FMP
How to Analyze Executive Compensation Using a Free API
Feb 02, 2026
Analyzing how top executives are paid can reveal important insights about a company's priorities and governance. Traditionally, gathering this data meant combing through proxy statements and SEC filings.
Today, however, you can access standardized executive compensation data instantly using a free API. In this guide, we'll show analysts how to get started with Financial Modeling Prep to retrieve executive pay details and benchmarks.
A Free Gateway to Executive Pay Data
For analysts assessing corporate leadership, having data on CEO and CFO pay is crucial early on. Are executives incentivized for long-term performance or short-term gains? How does a CEO's pay package compare to industry norms? If you've ever tried to manually find and compare executive salaries or total pay, you know it's tedious.
These questions can be answered quickly with an API that delivers the data in seconds.The data is pulled from official filings and normalized for you, so you spend less time on manual research and more time on analysis.
FMP's free API plan offers personal-use access (no credit card needed) with a generous 250-request daily limit, covering all U.S. listed companies. It's free with no subscription cost, and the free tier includes the core endpoints we need — though some advanced premium endpoints are only available on paid plans.
Let's get started. It's designed for self-service: you can try it on a single company now, see immediate value, and only then decide if you want to dig deeper.
Step 1: Get Your Free API Key and Set Up Access
To use the API, the first thing you need is a free API key. Signing up for FMP's free plan is straightforward. Go to the FMP's registration page, enter your email in the sign-up form, and create a password. After verifying your email, you'll receive a unique API key (a string of letters/numbers). This key is your access token for all API calls. Make sure to keep it safe.
Why the API Key?
FMP uses your key to authenticate free plan requests (which ensures you stay within the free daily allowance). With your key in hand, you have the green light to start pulling data. There's no software to install - you can call the API from your web browser, Excel/Google Sheets, or any programming language. The free plan's 250 calls per day are more than enough for testing and light analysis, and it covers profile and reference data like executive info by default. In short, you have everything needed to explore executive compensation data at no cost.
|
Expert Tip: After logging in, you can always find your API key on your dashboard. On the FMP documentation site, try the API Viewer tool - it lets you input an endpoint and your API key to run sample queries right in the browser. It's a great way to test your setup with zero coding. |
Step 2: Retrieve a Company's Executive Compensation Data
With your API key ready, you can now fetch the executive compensation data for any public company. FMP provides two closely related endpoints for this purpose:
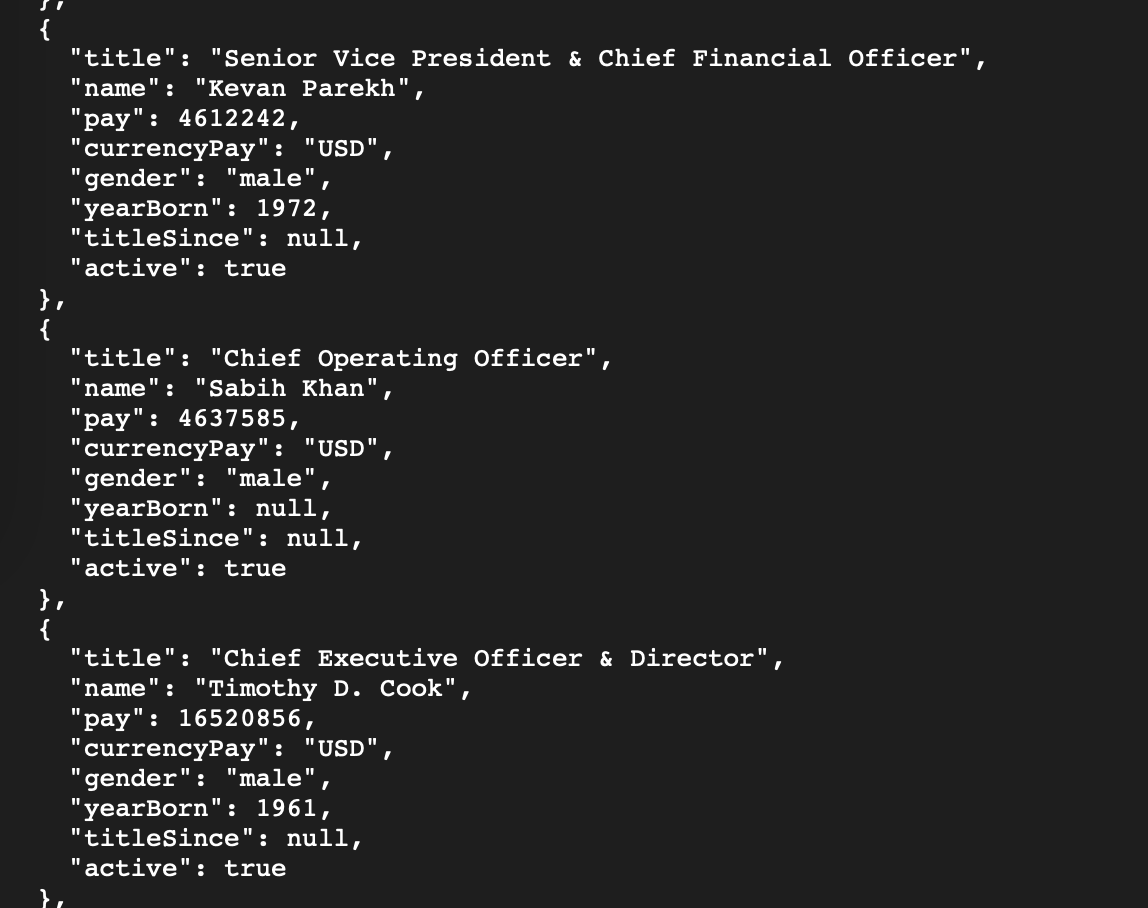
- Company Executives API - This returns a list of the key executives (e.g. CEO, CFO, etc.) and basic details including their titles and total pay figures. It's a quick snapshot of who's who in the C-suite and how much they earn.
- Executive Compensation API - This returns a detailed breakdown of compensation components for those executives, such as salary, bonus, stock awards, and total compensation, along with context like the fiscal year and filing date. Essentially, it's a more granular look at the numbers.
Let's walk through an example using Apple (AAPL), a company well-known for its high-profile leadership.
Call for Company Executives
First, we'll call the Company Executives endpoint to get the roster of Apple's top executives and their pay. The request is a simple HTTP GET query. In fact, you can try it in your browser by entering a URL like:
https://financialmodelingprep.com/stable/key-executives?symbol=AAPL&apikey=YOUR_API_KEY
Replace YOUR_API_KEY with the key you obtained in Step 1. This call asks the API for Apple's key executives. The response will come back in JSON format. Each executive will be listed with fields such as name, title, and pay. For example, Apple's CEO should appear in the results (Tim Cook, titled Chief Executive Officer & Director), along with his reported total pay (in USD). You'll likely see other figures like the CFO and other high-level officers, each with their compensation for the most recent year. If you're testing this via the API Viewer or a browser, you'll see a neatly structured JSON array of executives.
AAPL Company Executives in JSON format
Call for Executive Compensation
Now, for a deeper dive, let's use the Executive Compensation API for Apple. This endpoint provides the detailed compensation breakdown. The call is similarly straightforward:
https://financialmodelingprep.com/stable/governance-executive-compensation?symbol=AAPL&apikey=YOUR_API_KEY
This will return a JSON structure containing each key executive's compensation broken down by category (salary, bonus, stock awards, options, etc.), as well as the total. The API also includes metadata like the filing year and a link to the SEC filing where these numbers come from. That link is extremely useful for validation - if anything looks off, you can click through to the source document to double-check. But generally, you'll find the API data matches the official filings, just delivered in a clean JSON format.
AAPL Company Executive Compensation in JSON format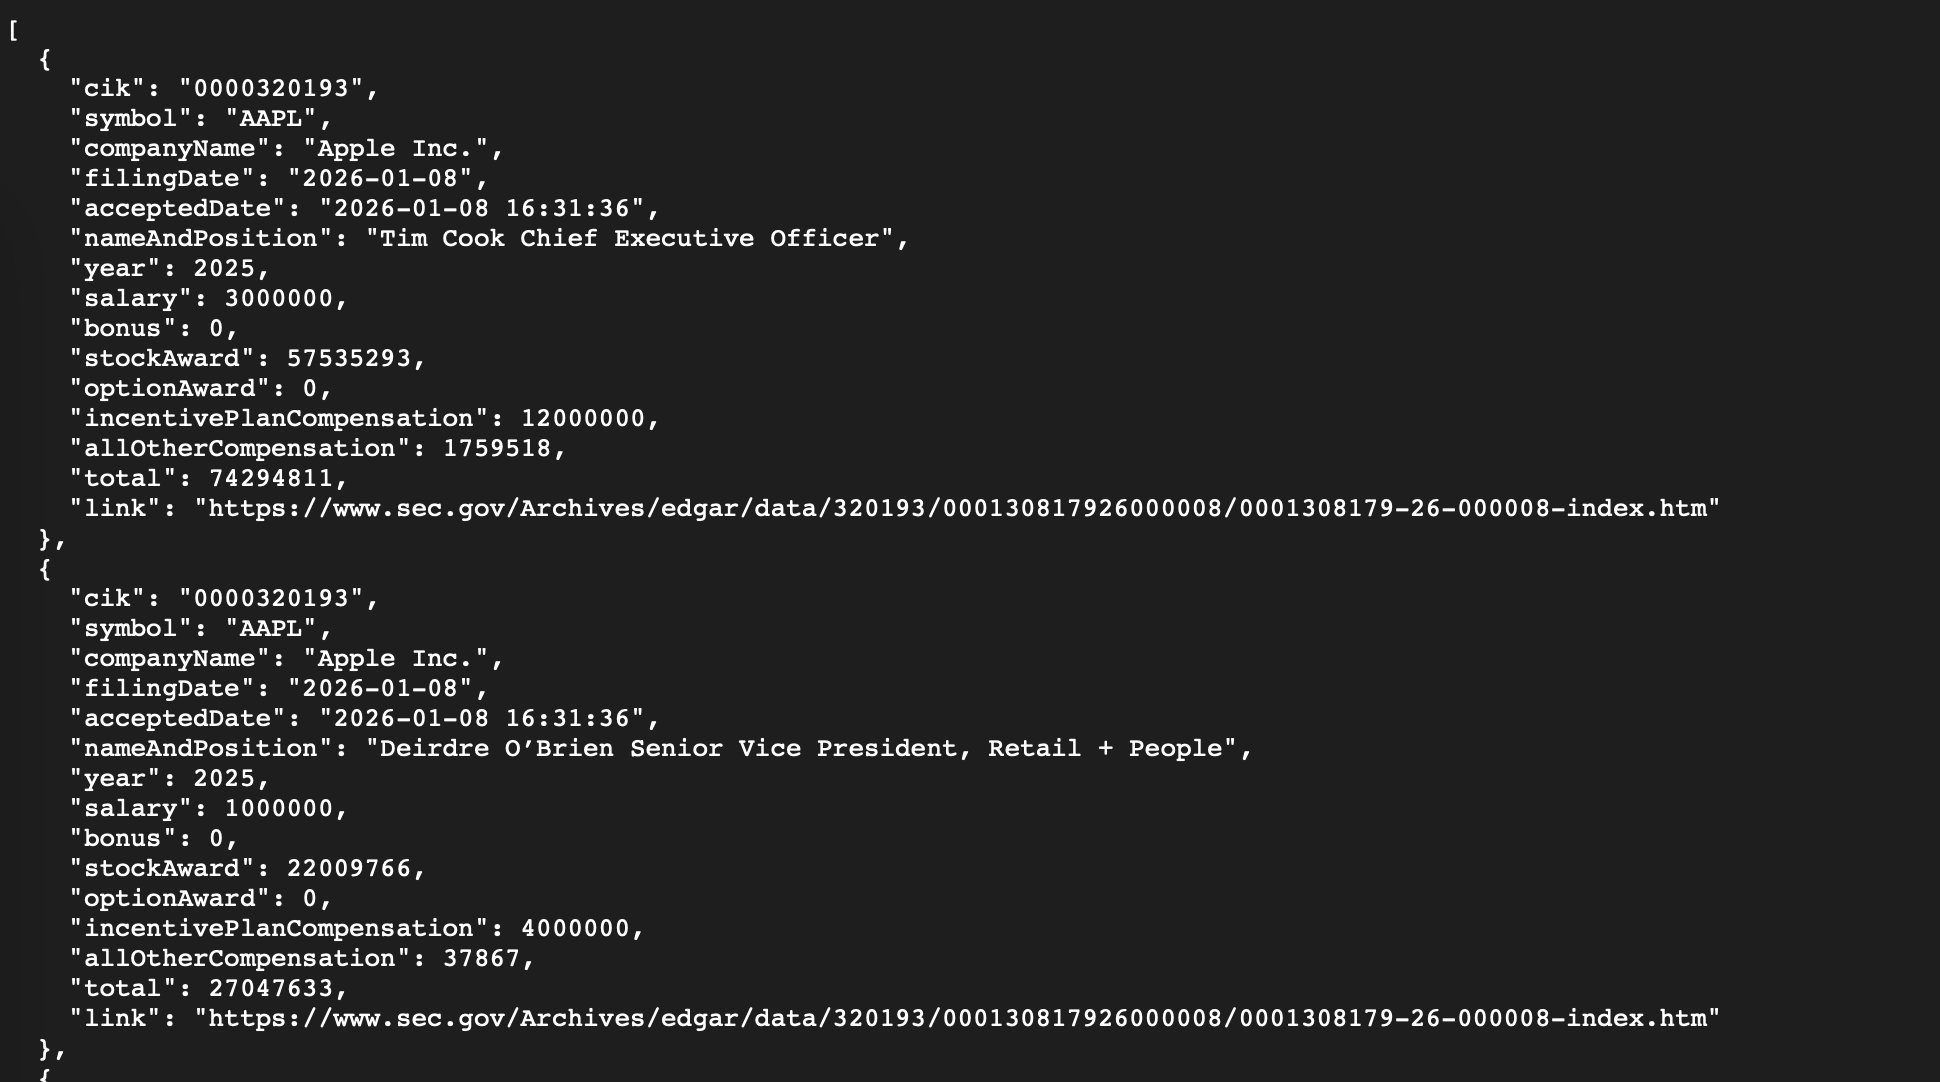
By retrieving data this way, we've solved a major pain point. In two quick calls, we gathered all of Apple's key executive pay info that would otherwise require digging through a proxy statement. The JSON format means you can easily feed this data into analysis tools, create charts, or compare multiple companies programmatically.
|
Expert Tip: The data is typically updated annually (since executive compensation is reported in annual proxy filings). FMP's API will include the latest reported year. For most companies, that corresponds to the last fiscal year's compensation. Always check the fiscalYear or date field in the response if you need to know the exact period covered. |
Step 3: Benchmark and Explore the Data (Industry Averages & Tools)
Raw numbers by themselves are useful, but the real insight comes from context. Is a given CEO's pay high or low relative to peers? To answer this, FMP offers an Executive Compensation Benchmark API that provides average compensation by industry. This is a powerful free resource for putting your company's data into perspective.
With a simple call to the benchmark endpoint, you can retrieve typical executive pay figures across different sectors. For instance, you can find out the average total executive compensation in the Technology sector vs. the Consumer Goods sector. If Apple's CEO earns significantly above the tech industry average, that's a noteworthy data point for your analysis. The benchmark data is essentially a quick answer to “What's normal in this industry?” - invaluable for compensation analysts and investors alike.
Call for Executive Compensation Benchmarks
To use the benchmark API, you don't even need a ticker symbol - it returns a list of industries with their average exec compensation values. The call is similarly straightforward:
https://financialmodelingprep.com/stable/executive-compensation-benchmark?apikey=YOUR_API_KEY
The response will list industry categories (like Technology, Financial Services, Healthcare, etc.) with metrics such as average CEO pay, or median executive pay for that group. With this, you can quickly see where your target company stands. For example, if the median Tech sector CEO earns $X million and your company's CEO earns 2× that, you've identified a potential outlier. Conversely, if it's below the industry norm, that's also telling. This kind of benchmarking is typically one of the first steps an analyst would take when evaluating executive pay - and now you can do it in seconds with a free API call.
Executive Compensation Benchmark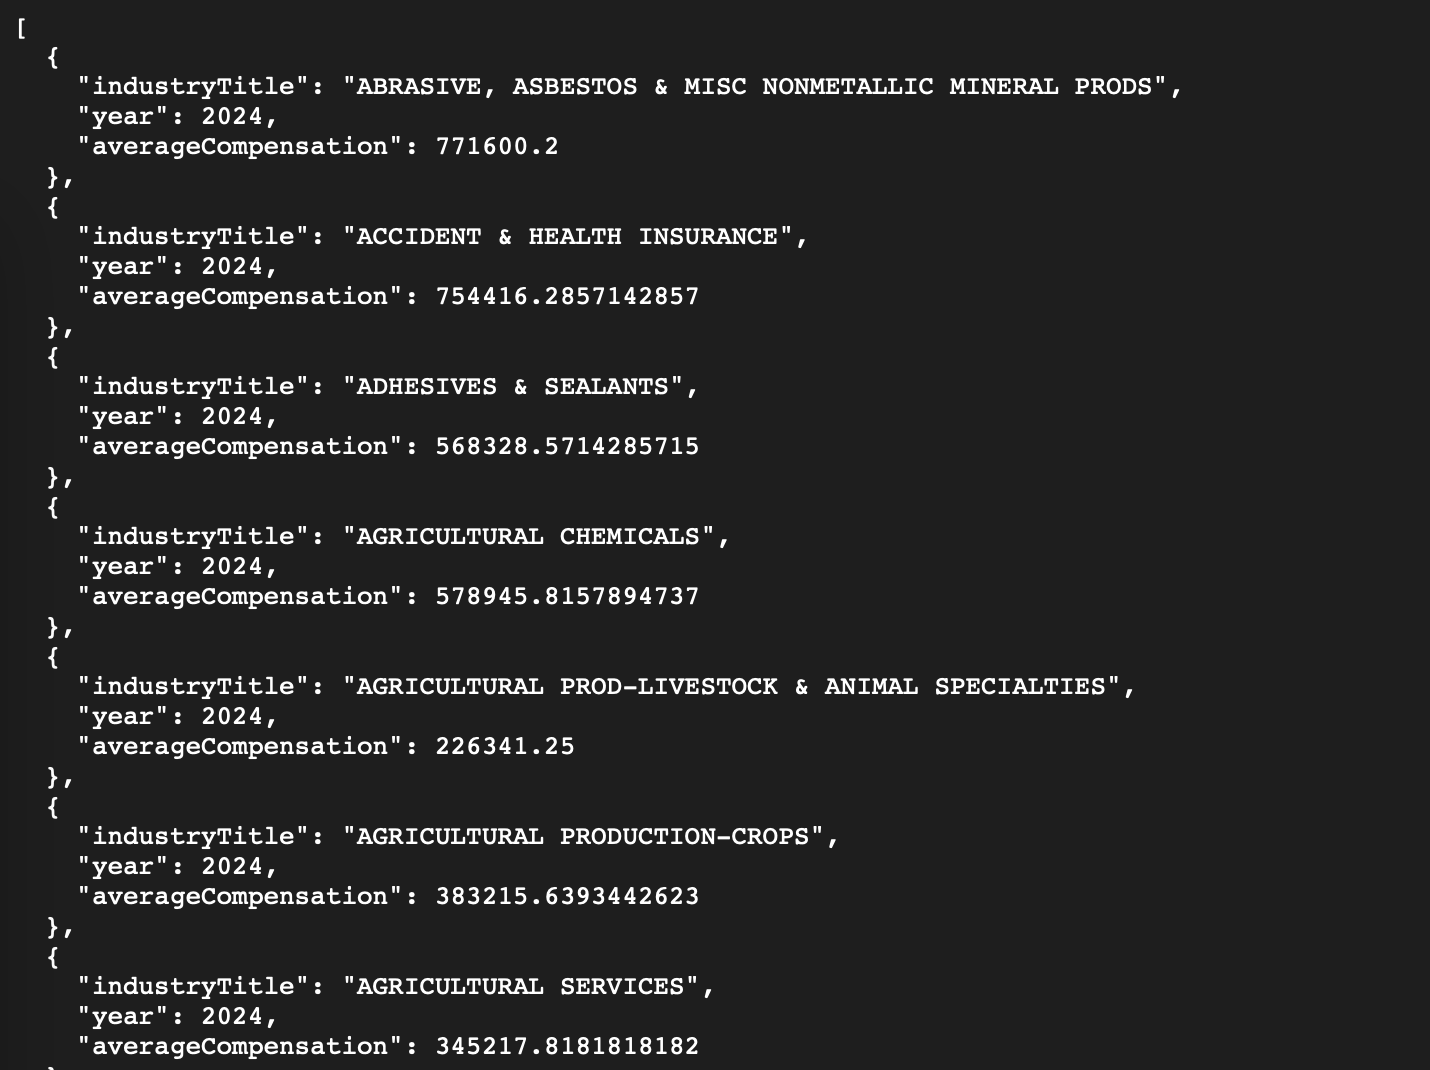
|
Expert Tip: It's always good to validate the data you retrieve. One way is cross-referencing a well-known figure. In our Apple example, media reports put Tim Cook's total compensation in the tens of millions of dollars range for recent years. The API returned a similar magnitude, which confirms the data is in the right ballpark. Additionally, the API's SEC filing link lets you verify each component of pay directly from the source. This transparency can give you confidence that the API isn't a “black box” - it's pulling real figures that you can verify and trust. |
Integrate With Your Favorite Tools
Once you have the data, how you use it is up to you - and FMP makes it easy to integrate with whatever workflow you prefer. Here are a few popular options:
- Google Sheets / Excel: FMP provides an add-on for spreadsheets, so non-programmers can fetch data with a simple formula. For example, typing =FMP.KeyExecutives("AAPL") into a cell will retrieve and populate Apple's executive list right in your sheet. You can then use normal spreadsheet functions to filter or compare values. This is ideal for quickly sanity-checking a few companies or creating a comparison table without writing any code.
- API Viewer (Web Playground): If you prefer a GUI approach, the FMP API Viewer is a web-based tool where you can plug in any endpoint and see the JSON results instantly. It's essentially a sandbox to try out API calls. For example, you could select the /key-executives endpoint, enter AAPL as the symbol, and hit "Run" to see the output right on the webpage. This requires no coding and is great for exploring the data structure or grabbing quick outputs. You can copy-paste results from here into your analysis or just use it to verify you're querying correctly.
- Custom Code (JavaScript/Python/etc.): For developers or those who want to integrate data into an app or analysis script, the API is language-agnostic. You can call it from any programming environment.
|
For instance, in JavaScript you might write: fetch("https://financialmodelingprep.com/stable/key-executives?symbol=AAPL&apikey=YOUR_API_KEY") .then(response => response.json()) .then(data => console.log(data)); |
This snippet will output the same JSON we saw earlier. Because the API is RESTful, it uses standard HTTP methods and JSON, making integration straightforward. Many analysts start by pulling the data into a Jupyter notebook or a small script to do more custom analysis (for example, computing averages across a set of companies or visualizing pay components in a chart). FMP's free API is designed for this kind of quick, programmatic exploration - you can try it, get the data, and there's no obligation to upscale unless you need more volume or coverage.
By leveraging these tools, you've essentially onboarded a powerful new dataset into your analytical arsenal with minimal effort. In a single afternoon, an analyst can sign up, fetch a few companies' executive compensation data, benchmark them, and glean insights that would have taken days of manual research. And because it's free and self-service, you can do all this without procurement hurdles or budget approvals.
Quickly Analyze Executive Compensation for Free
Accessing and analyzing executive compensation is no longer a task reserved for later stages of research - with a free API at your fingertips, it becomes an early and effortless part of your workflow.
FMP's platform is confidently built for analysts, offering clarity, credibility, and efficiency in data access. Now that you know how to get this data instantly, you can incorporate leadership compensation insights into your decisions right now, and see for yourself how it enriches your analysis. It's as easy as signing up, plugging in a ticker, and letting the data speak - all at zero cost.
If you found this useful, the next step is to continue exploring - perhaps look up a few competitors' executive pay or integrate other datasets like financial ratios to see the bigger picture. If you want more tutorials and guides on exploring our API's check out more API guides in our blog.
FAQ
Is executive compensation data really free on FMP?
Yes, Financial Modeling Prep offers a free plan. The main constraint is usage volume, with 250 requests per day on the free tier. FMP also states you don't need a credit card to use the free plan, which makes it easy to test without commitment. If you exceed the daily cap, you'll typically get a 429 (Too Many Requests) response until the limit resets the next day.
Which endpoint should I use first: “key executives” or “executive compensation”?
Use Company Executives first when you want a fast “who's who” view—names, titles, and headline compensation fields for key leaders. That gives you a quick scan of the C-suite and helps you confirm you're pulling the right people (CEO, CFO, etc.). Then switch to Executive Compensation when you need the granular breakdown (salary, stock awards, total comp, and related fields). In practice, analysts often start broad and then go deeper only for the specific executives they're evaluating.
Does the compensation endpoint include filing context for validation?
Yes, the Executive Compensation endpoint is designed to include filing details and links to official documents, which is exactly what you want for auditability. That means you can trace a number back to source materials instead of treating the API output as a black box. In a real workflow, this is useful for sanity checks (e.g., unusual jumps year-over-year) and for footnoting analysis. It also helps when stakeholders ask, “Where did this figure come from?” and you want a direct reference.
How do I benchmark a CEO's pay against “what's normal” for the industry?
Use the Executive Compensation Benchmark endpoint to pull average executive compensation by industry, then compare your company's CEO/CFO totals against that baseline. This is the quickest way to add context - high pay isn't inherently “bad,” but it's more meaningful when you know whether it's above typical levels for that sector. Benchmarking also helps you spot outliers worth investigating (e.g., unusually high equity awards or unusually low base salary). After you identify a gap, you can follow up by reviewing company performance metrics and pay mix to interpret the “why.”
Can I do this without coding?
Yes, FMP's API Viewer (also described as a “Playground”) is a web-based, interactive tool for exploring endpoints without writing code. You select a dataset/endpoint, enter parameters (like a ticker), and immediately see the returned data in the interface. This is great for learning the schema, validating your API key works, and quickly checking outputs before building spreadsheets or scripts. Many analysts use it as a first stop to confirm they're querying the right endpoint and fields.
Can I pull exec comp data into Excel or Google Sheets?
Yes, FMP provides an Excel/Google Sheets add-on and maintains documentation for integrating FMP data into spreadsheets. This is helpful if you want a no-code or low-code workflow for building comparison tables, filtering executives, or calculating deltas year-over-year. Once connected, you can refresh data as needed and keep your analysis model “live” without manually copying JSON.

Top 5 Defense Stocks to Watch during a Geopolitical Tension
In times of rising geopolitical tension or outright conflict, defense stocks often outperform the broader market as gove...

Circle-Coinbase Partnership in Focus as USDC Drives Revenue Surge
As Circle Internet (NYSE:CRCL) gains attention following its recent public listing, investors are increasingly scrutiniz...

LVMH Moët Hennessy Louis Vuitton (OTC:LVMUY) Financial Performance Analysis
LVMH Moët Hennessy Louis Vuitton (OTC:LVMUY) is a global leader in luxury goods, offering high-quality products across f...

