Stock Fair Value Calculation Using DDM Equity Valuation Model
Oct 15, 2024(Last modified: Nov 19, 2025)
As you may know, there are three main equity valuation models.
- The Discounted Cash Flow (DCF) model discounts a company's free cash flow by the WACC (weighted average cost of capital), calculates the company's Terminal Value, discounts it by the WACC, sums up the result to get the Enterprise Value, then deducts debt and adds cash to project the market cap. The last step is to divide the forecasted market cap by the number of shares outstanding to obtain the company's fair value per share or stock target price. I've written a complete guide on how to calculate a company's target price using a great API endpoint and build your custom web-based application using JavaScript.
- Another useful equity valuation model is the Price-Income Model. In this model, you calculate the company's financial ratios from financial statements, compare those ratios to the closest peers, assign certain weights to each ratio (based on your assumptions), and calculate the coefficient. Then multiply this coefficient by the stock market price to obtain the stock's fair value. This simple valuation model requires fewer assumptions than the DCF model but is less accurate. I've written a complete guide on stock target price calculation using financial ratios valuation model.
- The last equity valuation model is the Dividend Discount Model (DDM). Let's dive deeper into this model and explore its possibilities. I will explain how to calculate the stock target price using the DDM model.
What is the Dividend Discount Model
The Dividend Discount Model forecasts a company's dividends using the Gordon and Prat models, then discounts dividends by the cost of capital rate, calculates the Terminal Value per share, and also discounts it, then sums up the discounted amounts. This would be your stock's target price. Please keep in mind that this model can only be used for companies that regularly pay dividends. Otherwise, you can use the DCF or the Price-Income models.
Initial Setup
Now that you know how the DDM model works, let's start gathering data for calculations and then perform actual stock target price calculations. To start building the DDM model, you'll need to extract data from the company's financial statements. For this, we'll be using various API endpoints. Ideally, you need to extract data for 10 years, but I only do 4 in my example, to simplify everything.
1. The first thing we need to extract is the cash dividends declared (dividend paid), which can be found in the Cashflow Statement API endpoint. This is the amount of dividends paid by the company to its shareholders.
2. The next step is to extract the company's net income, which can be found in the Income Statements API endpoint. Net income shows how much profit the company is making after deducting direct and indirect costs and taxes. Then, extract the company's net sales or revenue for the last 10 years, which can also be obtained from the Income Statements API endpoint.
3. The last two items are total assets and shareholders' equity, which can be found in the Balance Sheet Statements API endpoint. Shareholders' equity mainly consists of retained earnings, issued equity, and reserve items.
After extracting everything and building the table, you should have something that looks similar to this:
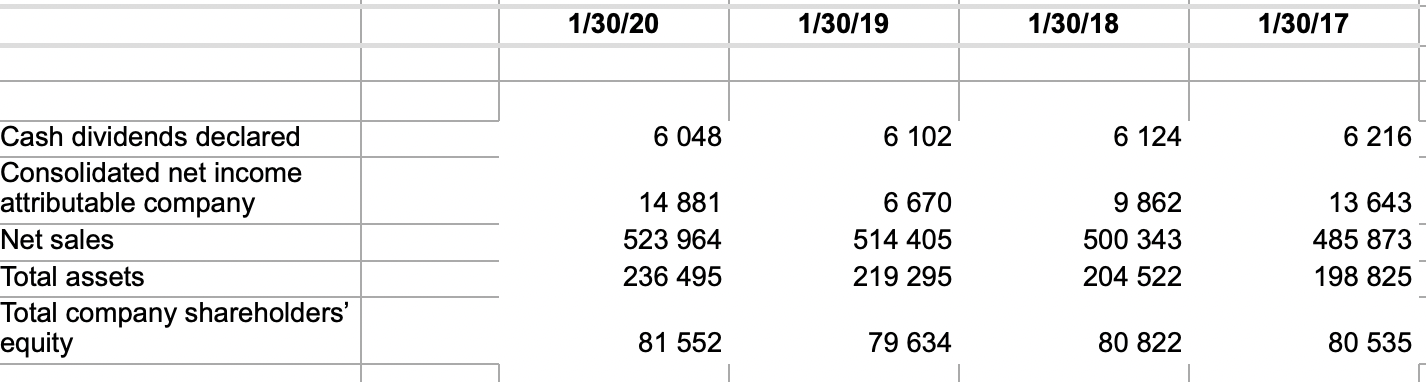
Please note that I used data for 4 years to simplify this model, but ideally, you should use a larger data set. Investment analysts usually gather data for the last 10 years.
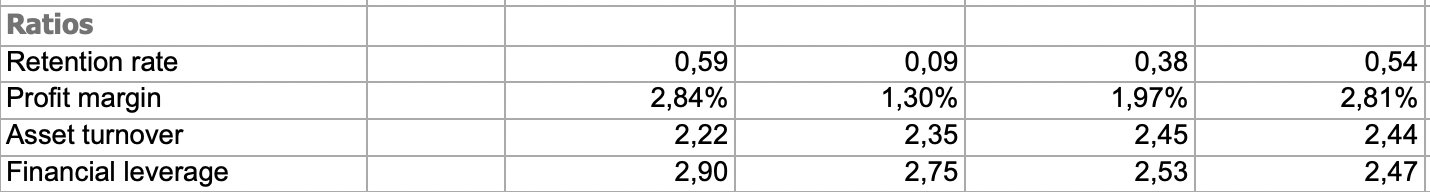
4. The next step is to calculate ratios for each year from your extracted data. We'll need the Retention Rate, Profit Margin, Asset Turnover, and Financial Leverage ratios. First, let's start with the Retention Rate. The Retention Rate is calculated as net income minus cash dividends declared, divided by net income. It shows how much of the net income remains in the company after paying dividends. These retained funds can later increase shareholders' equity if they aren't redistributed for other purposes, such as paying debts or investing in equipment, for example.
5. The next item needed for analysis is the Profit Margin. The Profit Margin is calculated by dividing net income by net sales or revenue, showing how much profit remains from each $1 of sales after deducting direct and indirect costs and taxes. The higher the margin, the better for the company, as it indicates management's efficiency in cost management.
6. Next, calculate the Asset Turnover Ratio. It is calculated by dividing net sales or revenue by total assets. This helps to see how efficiently the company uses its assets to generate sales. A higher ratio is better, as it indicates that the company can generate higher sales with the same assets, without heavily investing in new equipment, for example.
7. The last ratio is Financial Leverage. It's calculated by dividing total assets by shareholders' equity. A lower ratio is better as it indicates the company relies more on its own funds. However, if the ratio rises yearly, it suggests the company is increasingly relying on borrowed funds, which can increase credit and liquidity risks.
After performing these calculations, your table should look something like this, where you calculate the listed ratios for each year. As I mentioned, ideally, you should have observations over 10 years, but I used 4 years to simplify this model for the purpose of this article.
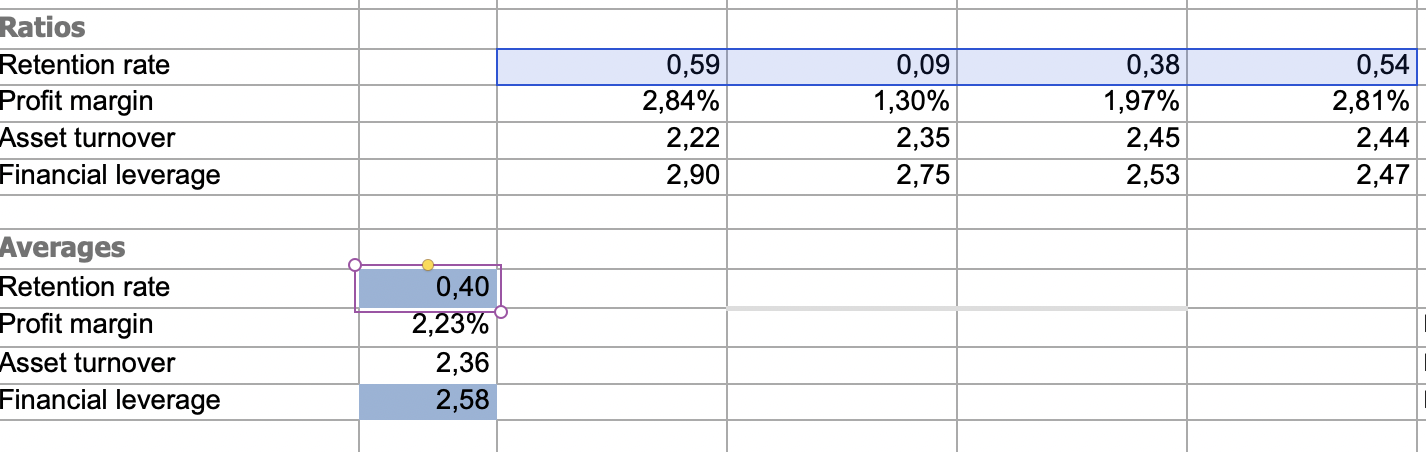
The Next Step is to Calculate Averages of Those Ratios. This step is simple and does not require complicated calculations.
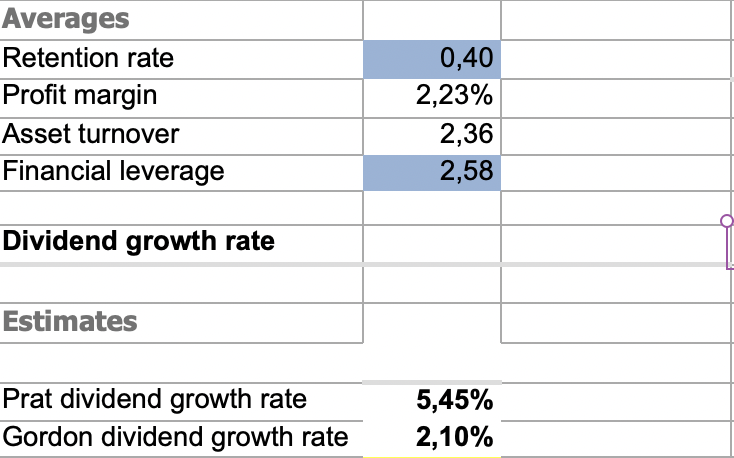
Prat and Gordon Models for Calculating Dividend Growth Rate
Next, employ the Prat and Gordon models for calculating the dividend growth rate. Prat's formula is straightforward; simply multiply all ratio averages by each other. For the Gordon dividend growth rate calculation, you need to
multiply the stock's current market price by the cost of equity minus the dividend for the first year and divide everything by the current market price plus the dividend for the first year.
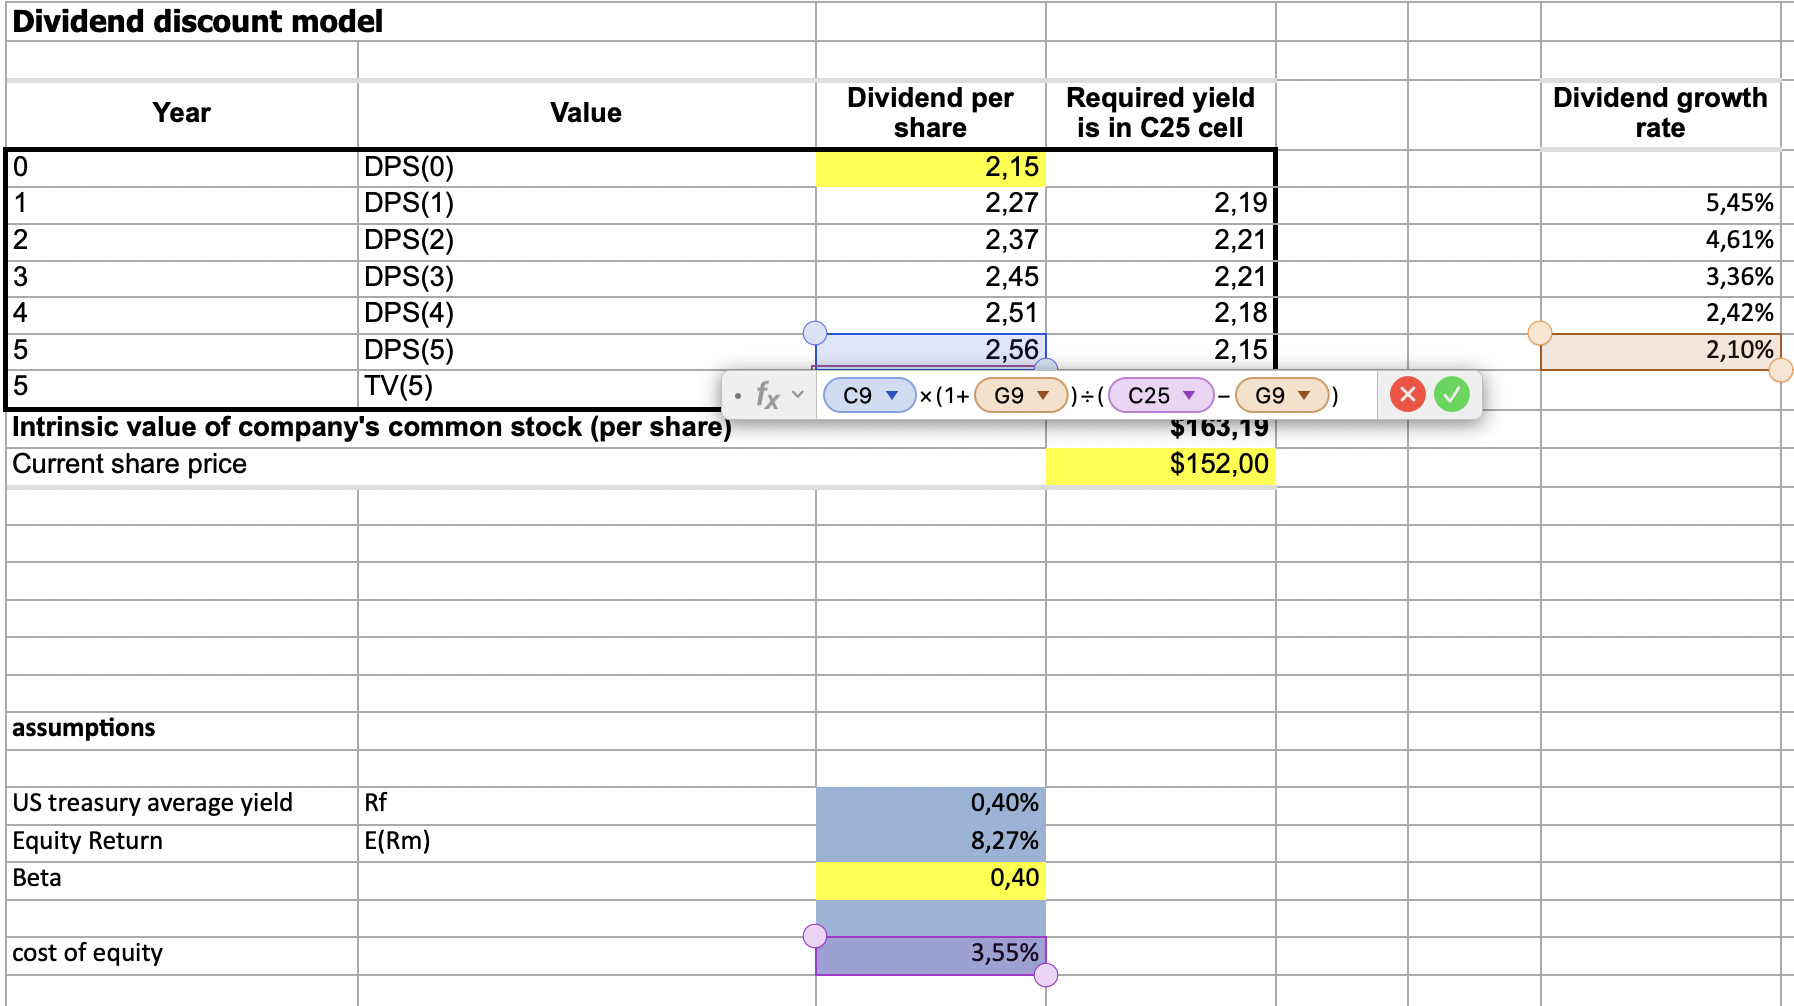
To calculate the cost of equity, add the US Treasury yield (average yield across different maturities) to the Beta and multiply by the stock's yearly return minus the US Treasury yield.
Beta shows stock volatility relative to the index or market. For US stocks, Beta compares the stock to the S&P500 index.
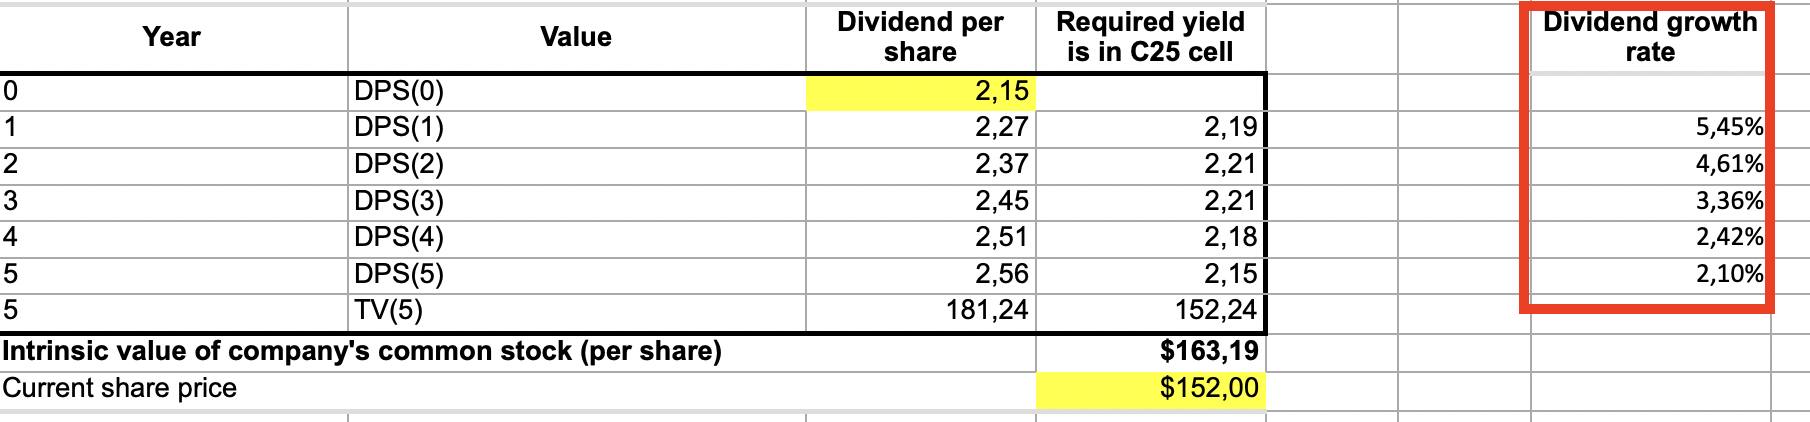
This would be your table after calculations:
Dividend growth rate forecast.
To forecast dividend payments, you need the dividend payment for the last year, or the last known dividend. In my example, it's $2.15. Then fill the dividend growth rate table as shown below:
To calculate the dividend growth rate for the second year, 5.45% in this example, take the Prat growth rate.
For the third year, the formula is:
second-year growth rate + (last year growth rate of 2.10% - second-year growth rate) * (2 - 1) / (5 - 1).
We take 2, because we calculate based on the second year, for the fourth year we will multiply by 3 and so forth. We take 5, because we try to forecast for 5 years. In my example it would be:
5,45% + (2,10% - 5,45%) * (2 - 1) / (5-1)
The growth rate from the last year, 2.10% in this example, is the Gordon dividend growth rate calculated previously. Do the same calculations for the fourth and fifth year, but instead of using the dividend growth rate for the second year use dividend growth rate for the third and fourth year respectively and also replace 2 in the formula by 3 and 4 respectively.
Forecast dividends.
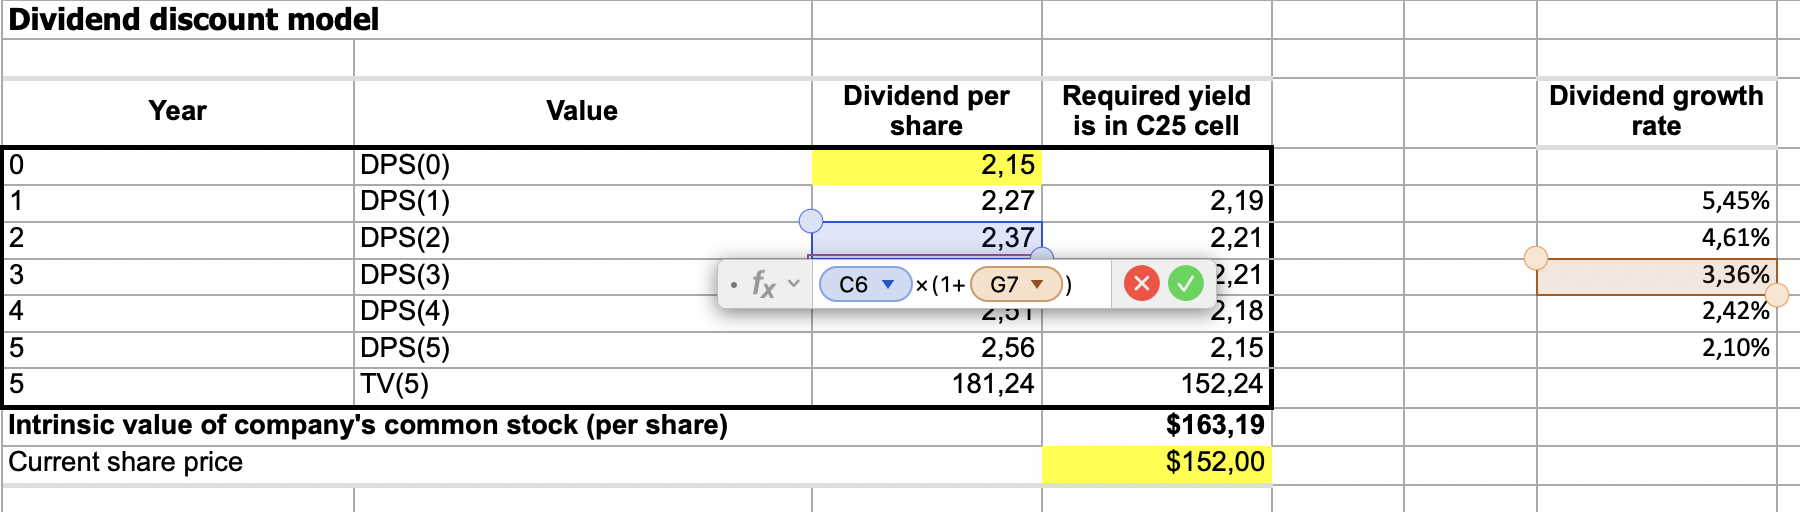
To forecast the dividend for the second year, use the formula: Dividend for the first year * (1 - dividend growth rate for the second year). Repeat for all remaining years but adjust the dividend growth rate as shown for each year.
Do the same calculations for all the remaining years but replace the Dividend for the first year by the dividend growth for the third, fourth and fifth year respectively. In the below example i calculate the dividend for the fourth year. You can see the formula
Calculating Terminal value per share.
To calculate the terminal value, use this formula:
Forecasted dividend for the last year * (1 + last year's dividend growth rate) / (Cost of capital - last year's dividend growth rate).
From my example:
TV = 2,56% * (1 + 2,10%) / (3,55% - 2,10%). See below for calculations.
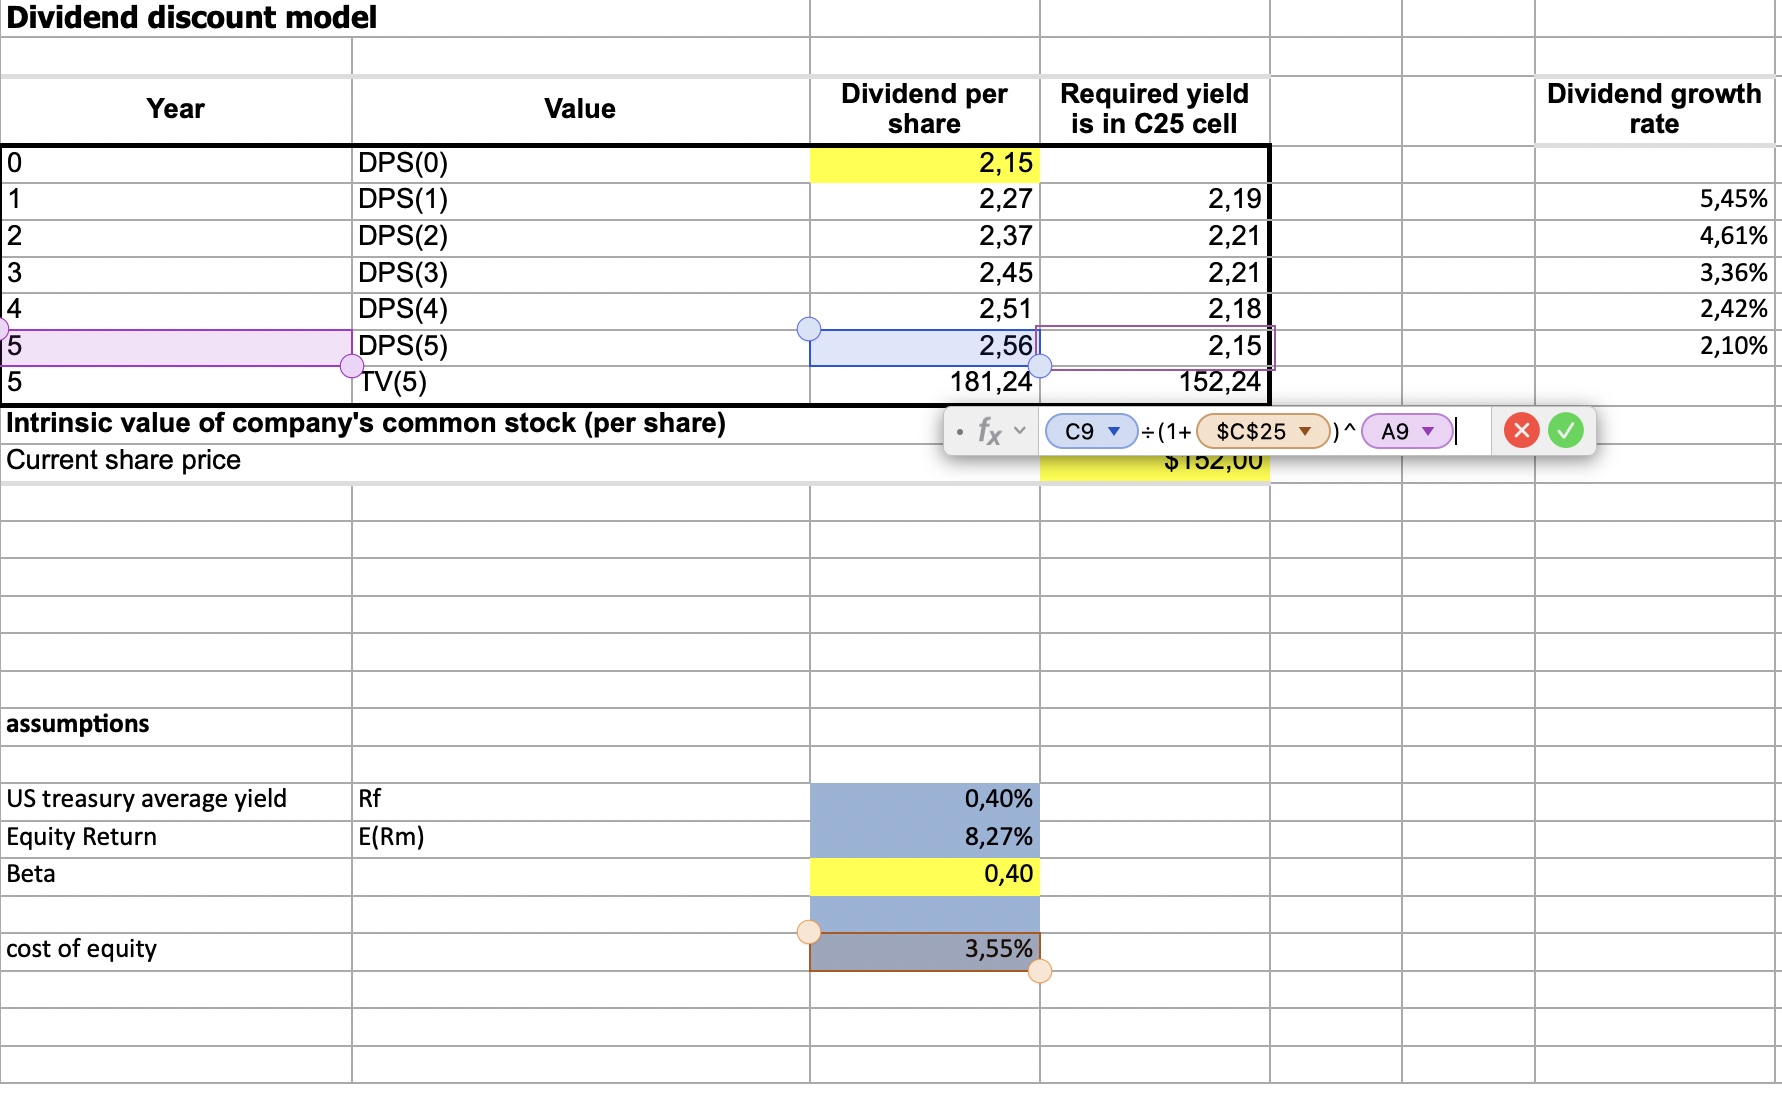
Discounting Dividends and Terminal Value Per Share
Next, discount dividends and terminal value by the cost of equity. In our example, use this formula for discounting the last year's forecasted dividend:
last year's forecasted dividend / (1 + cost of equity) ^ 5. Adjust for other years by changing the year number.
We take 5 because it is a last year. Do the same for other years but replace 5 with the relevant year number and relevant dividend for that year. For forecasting the terminal value, divide the calculated terminal value per share by (1 - cost of equity) ^ 5. We take a power of five because we made a forecast for 5 years.
Calculating the Stock Target Price
The final step is to sum the discounted amounts, including discounted dividends for all 5 years plus the discounted terminal value. When we add everything together
(2.19+2.21+2.21+2.18+2.15 + 152.24), we get 163.19,
which is the stock target price based on the DDM valuation model.
This is how you can calculate the stock target price based on the Dividend Discount Model. Keep in mind that this model is only applicable to companies that regularly pay dividends. I have a tutorial guide on building a simple application using JavaScript and Financial Modeling Prep's Advanced DCF API to calculate stock target prices. For simpler ways to calculate stock target prices, you can refer to the article on the Price-Income Valuation Model, where I show how to use financial ratios for stock target price calculation. I hope this guide helps you calculate stock target prices using the Dividend Discount Valuation Model.

Top 5 Defense Stocks to Watch during a Geopolitical Tension
In times of rising geopolitical tension or outright conflict, defense stocks often outperform the broader market as gove...

Circle-Coinbase Partnership in Focus as USDC Drives Revenue Surge
As Circle Internet (NYSE:CRCL) gains attention following its recent public listing, investors are increasingly scrutiniz...

LVMH Moët Hennessy Louis Vuitton (OTC:LVMUY) Financial Performance Analysis
LVMH Moët Hennessy Louis Vuitton (OTC:LVMUY) is a global leader in luxury goods, offering high-quality products across f...

