FMP
The Best Way to Stream Live Stock Data into Excel Without Macros
Dec 22, 2025
Manually copying stock prices and financials into Excel is slow, error-prone, and wastes analyst time. Spreadsheet data often becomes outdated before the next refresh, leading to flawed decisions.
FMP's Excel Add-In streamlines this workflow by directly integrating live market data and company financials into your workbook using simple formulas. In this guide, you'll learn how to replace manual CSV imports with FMP functions and built-in tools to build an auto-refreshing Excel model for real-time quotes, historical prices, and key financial metrics - all without writing macros.
The Pitfalls of Manual Data in Excel
Traditional workflows rely on exported CSVs or copy-pasted prices. This introduces errors from outdated data and typos, and maintenance can hog hours each week. For example, updating a portfolio of tickers or refreshing quarterly results usually involves repeated downloads and copy-paste steps.
During fast-moving markets or earnings season, data can become stale the moment you paste it. In short, manual updates mean delayed insights and wasted effort. Automated, live data solves these problems by keeping your models current and reducing risk.
Key Problems with Static Updates:
- Outdated data: Prices and financials may be stale by the time you finish pasting them.
- Human errors: Manual entry introduces typos and formula mismatches.
- Wasted time: Maintaining spreadsheets takes staff hours away from analysis.
- Duplicate work: Teams often repeat the same imports, leading to inefficiency and potential version conflicts.
The solution? Use FMP's Excel Add-In to fetch data on demand. This way, your sheets can refresh instantly from live APIs, turning Excel into a dynamic dashboard rather than a static report.
Meet the FMP Excel Add-In
The FMP Excel Add-In is a free plugin that lets you call Financial Modeling Prep APIs directly from Excel formulas. (If you haven't installed it yet, follow the installation guide) Once installed and connected with your FMP API key, an “FMP” menu appears in the ribbon. This tool provides:
- Custom Functions: Prefixed with FMP. (e.g. FMPPRICE), these pull data like stock prices, dividends, and financial statement items.
- Function Builder: A search box to browse available functions and data fields without leaving Excel.
- Statement Dump: A one-click tool to import full income statements, balance sheets, cash flows, and key metrics for a ticker.
- Refresh Button: A toolbar button to refresh all live data in the sheet at once.
Getting started: After installing, click FMP > Snow Taskpane, enter your API key from the FMP dashboard, and choose Excel as the output format. Now the add-in will handle all API calls behind the scenes. You can reference stock tickers, parameters, and date cells in formulas just like native Excel functions. This eliminates copy-paste: any time you recalc or hit “Refresh Data,” Excel pulls the newest quotes and fundamentals from FMP.
Pulling Real-Time Stock Quotes
To retrieve live stock prices, get your own API key, then use the FMPPRICE or FMP function. For example:
|
=FMPPRICE("AAPL","Price") |
This single formula returns Apple Inc.'s latest price in the cell. (You could also use =FMP("AAPL","Price") in the same way.) You can put the ticker symbol in a cell (say A2) and reference it:
|
=FMPPRICE(A2,"Price") |
Now changing A2 from “AAPL” to “MSFT” immediately re-fetches Microsoft's price. The Add-In automatically updates the value whenever you recalc or press its Refresh Data button. (At any time, click the FMP ribbon's Refresh icon to pull all live quotes and metrics)
This live quote function connects to FMP's real-time market data. FMP's Stock Quote API feeds the FMPPRICE function, supplying up-to-the-minute price, change, volume, bid/ask, and more.
For example, behind the scenes FMPPRICE calls the same data as the Stock Quote API. Excel users can even try the API URL themselves, such as:
|
https://financialmodelingprep.com/stable/quote?symbol=AAPL&apikey=custom_key |
to see the JSON response. But with the Add-In, you skip the programming: just type the formula and get data.
Benefits of real-time formulas:
- Instant updates: Link stock tickers directly; the cell always shows the latest price or percentage change.
- Bulk tickers: Supply a range of tickers (e.g. A2:A10) to FMPPRICE to get an array of prices in one go.
- Multiple fields: Request other fields like "change", "dayLow", or "marketCap" by changing the parameter in quotes (see Explorer for field lists).
- No macros needed: All calls run asynchronously; your Excel sheet stays responsive while data loads.
By streaming quotes instead of copying CSVs, your price-tracking models become live dashboards.
For example, you could build a watchlist: column A lists tickers, column B uses =FMPPRICE(A2,"Price"), column C uses =FMPPRICE(A2,"changesPercentage"), and so on. Now each time you open or refresh the sheet, Excel fetches fresh data for every symbol.
Pulling Historical Price Data
To work with historical stock data, FMPPRICE also supports date ranges. Use the optional days or start/end date arguments. For example:
- =FMPPRICE("AAPL","Close",30) returns the last 30 days of closing prices (as a vertical range of values).
- =FMPPRICE("AAPL","Close",, "2023-01-01", "2023-12-31") returns all daily closes for 2023.
Each call fills multiple cells with a series (open, high, low, close, volume by default). You can also specify a single date:
|
=SUM(FMPPRICE("AAPL","Close",, "01/28/2022")) |
returns Apple's close on 2022-01-28 (using SUM to collapse the single-cell output).
FMP provides Stock Price and Volume Data API that power these formulas. And it can fetch 30+ years of daily history for a ticker. By leveraging FMPPRICE, Excel users can retrieve this rich history on demand.
Uses of historical price data:
- Charting and analysis: Populate an Excel chart's data range with a FMPPRICE output to create time-series charts (line, candlestick, etc.).
- Date arithmetic: With dates in cells, use them to set the start date/end date arguments dynamically.
- Multiple tickers: Query multiple tickers at once by passing a range (e.g. FMPPRICE(A2:A10,"Close",30) pulls 30 days for each symbol).
- Adjusted prices: Use parameter "adjClose" for dividend-adjusted prices, or "Dividend" to get dividend history.
Historical stock prices with VHLOC.
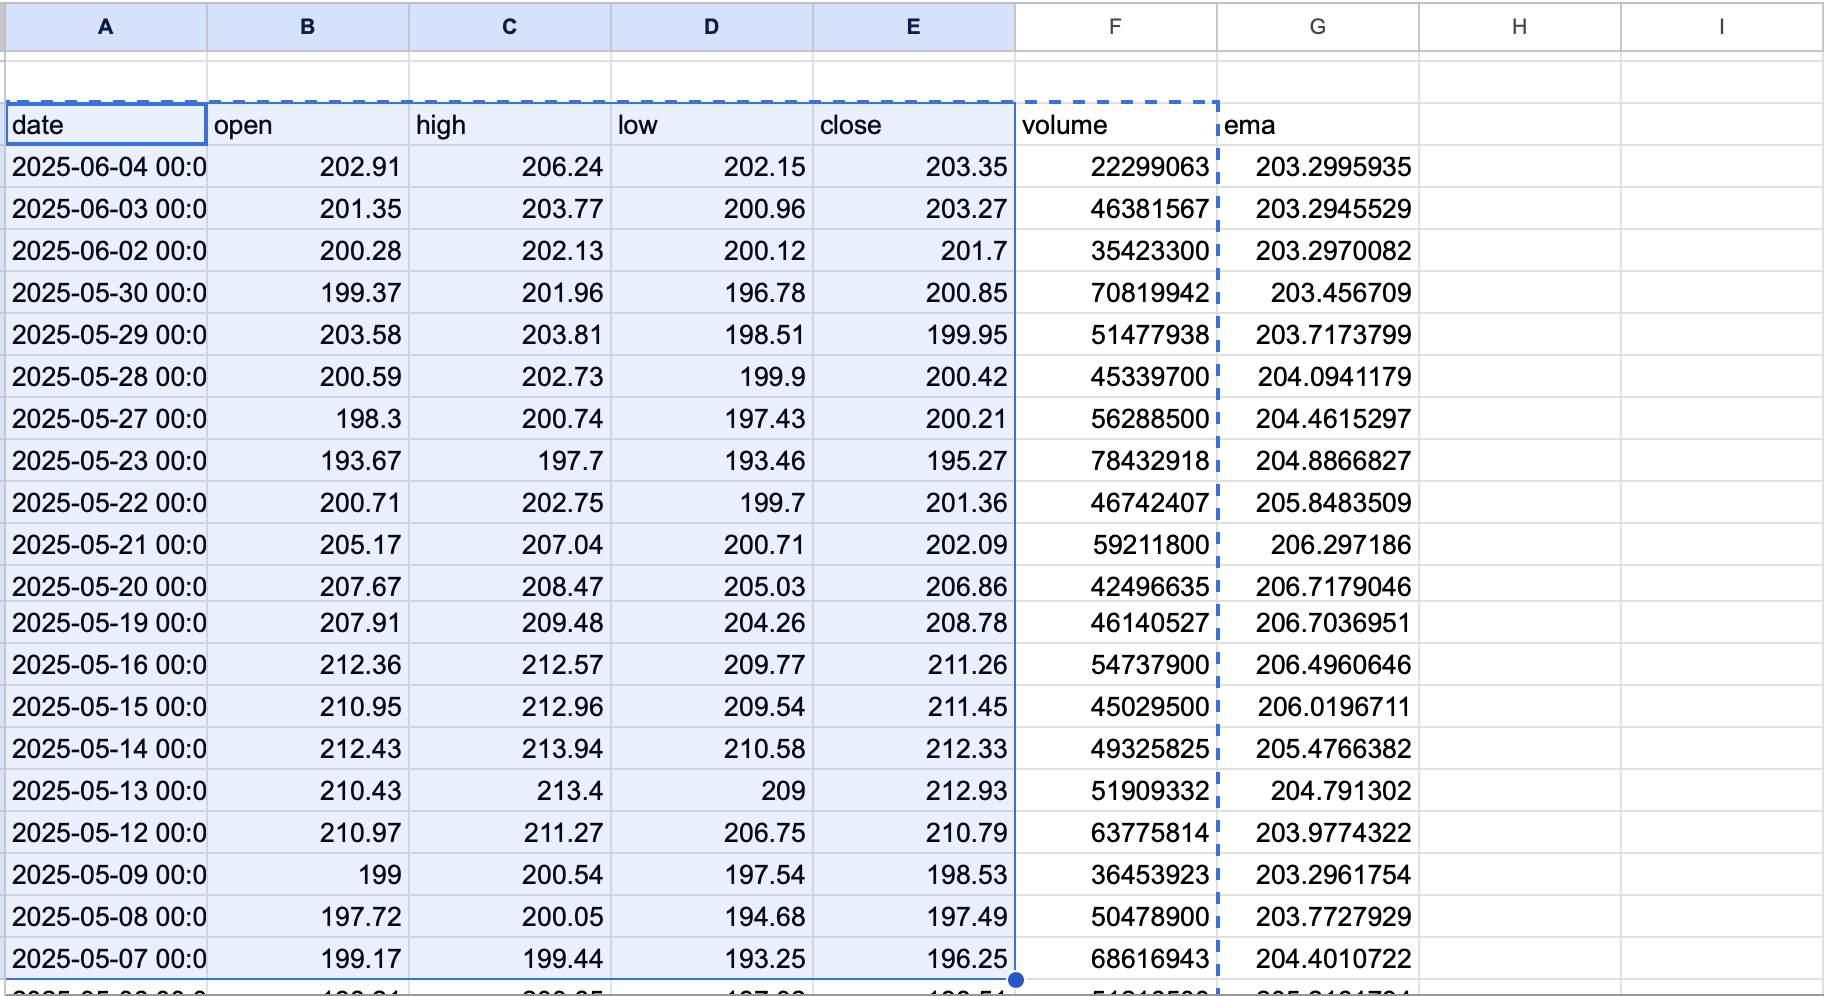
This beats static CSV imports: once your history formula is in place, it updates like any formula. If you change the ticker or date cells, Excel fetches new data automatically. You can also schedule Excel to refresh on file open or every few minutes, ensuring your charts and calculations always reflect the latest time series.
Fetching Company Financials and Metrics
Beyond prices, FMP's Add-In can pull company fundamentals - income statement, balance sheet, cash flow, and key ratios - via the FMP function. For example:
- =FMP("AAPL","Revenue",2022) returns Apple's 2022 total revenue.
- =FMP("AAPL","Net Income","TTM") returns the trailing twelve-month net income.
- =FMP("TSLA","ROE","LQ") returns Tesla's latest quarter's Return on Equity.
In these calls, the parameters are ticker, field, and period (year, “TTM” for trailing, “LY” for last fiscal year, “LQ” for last quarter, etc.) You can insert cell references for any argument, making it easy to drag formulas across tickers or years. Need revenue per share or EBITDA? Simply change the parameter string to "Eps" or "EBITDA".
FMP's Financial Statement APIs back these functions, delivering clean, structured data. It also enables tracking profitability and trends. Excel simply wraps these in cell formulas so you don't have to parse JSON.
Use cases for financial data in Excel:
- Financial ratios: Calculate margins or growth by referencing FMP fields (e.g. use =FMP("AAPL","Gross Profit",2022) and =FMP("AAPL","Revenue",2022) in adjacent cells to compute gross margin).
- Forecasting models: Fetch historical revenue or expenses for model inputs; update assumptions by changing the year argument.
- Peer analysis: List multiple tickers in a range and have =FMP(A2:A5,"ROE","TTM") fill a table of ROE for each.
- Statement Dump: For a one-shot import, use the Statement Dump feature. This tool lets you fetch full statements and key metrics with one click. It places all recent years' or quarters' financials into your sheet, which you can then reference in formulas or pivot tables.
Peer analysis with key metrics and financial ratios extracted into Excel.
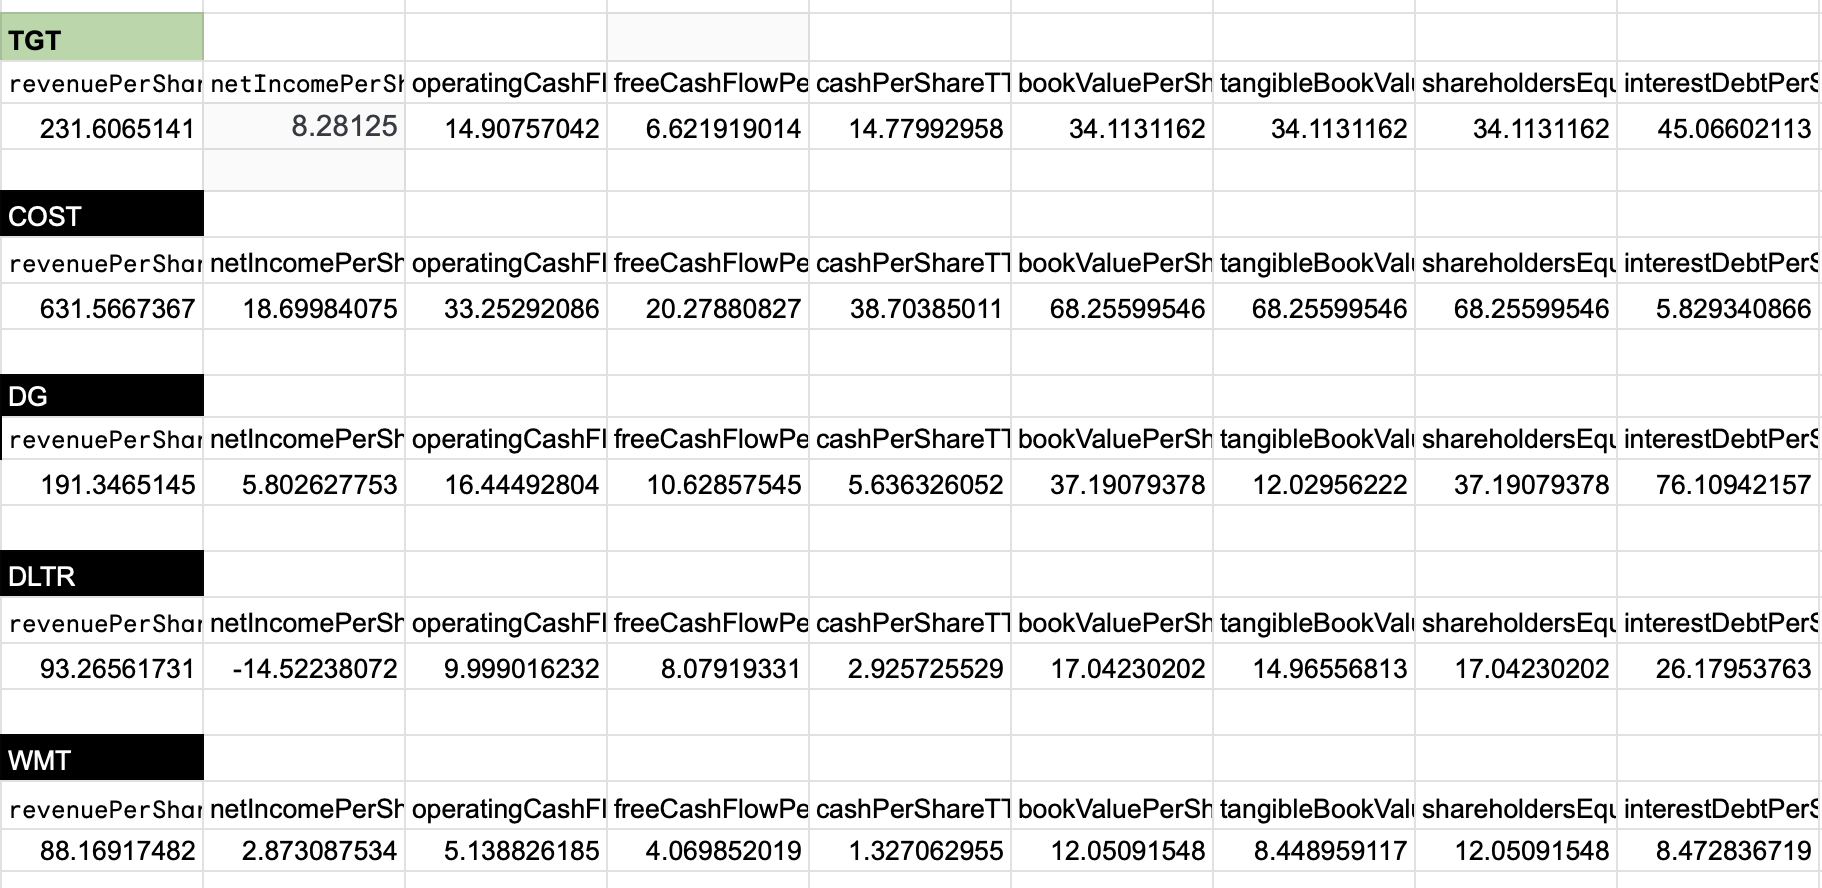
All retrieved financial data stays live. Want to update to the latest quarter as soon as it's out? Change "LY" to "LQ" or "TTM", refresh the sheet, and the numbers update. Because FMP's data refreshes continuously, your Excel model can reflect real-time filings as they are reported.
Building a Live Excel Model: A Simple Example
Let's illustrate by building a basic stock tracker in Excel.
- Setup Ticker Parameter: In cell A2, type a ticker symbol (e.g. AAPL). Name this cell Ticker for convenience.
- Insert Price Formula: In B2, enter =FMPPRICE(Ticker,"Price") to get the current price. In C2, enter =FMPPRICE(Ticker,"changesPercentage") for daily % change.
- Add Historical Query: In D2, enter =SUM(FMPPRICE(Ticker,"Close",30)) to calculate the 30-day change (sum of daily closes or use your preferred calculation). Or use =FMP("AAPL","beta","TTM") in E2 to fetch the trailing beta.
- Pull Financial Data: In F2, use =FMP(Ticker,"Revenue","LY"), and in G2 =FMP(Ticker,"Net Income","LY"). These link to the last fiscal year's revenue and net income.
- Automation: Now set Excel to refresh on open (Data > Queries & Connections > Properties > Refresh data when opening the file). Whenever you open the workbook, Excel will call FMP and update all these cells.
Because we parameterized formulas with the Ticker cell, changing A2 to another symbol (e.g. “MSFT”) cascades updates through B2:G2. No manual copy-paste is needed. You could expand this model: add rows for more tickers, drag formulas, or insert charts referencing these cells. For example, chart B2:B5 to plot current prices for a list of stocks. All of this can be in live sync with the market.
Expert Tip: Use ranges to pull bulk data. For instance, to get 5 years of revenue and net income at once, you might use =FMP("AAPL", {"Revenue","Net Income"}, {2018,2019,2020,2021,2022}). The function returns a block of values you can arrange in a table. This is much faster than writing 10 individual formulas. Also, the Function Builder in the FMP pane can auto-generate these formulas once you select fields and tickers.
For a more thorough list of formulas and usage examples, see FMP's Excel Add-On Documentation and Function Explorer. These explain every available field (e.g. price, volume, all financial ratios, etc.) and how to use them.
FAQ
Do I need VBA macros or coding to use the FMP Excel Add-In?
No. The whole point of the FMP Excel Add-In is that it pulls real-time quotes, historical prices, and company financials using simple Excel formulas. Once your API key is connected, the add-in handles the API calls behind the scenes. You just type functions like =FMPPRICE() or =FMP() and let Excel do the rest.
How does the workbook stay up to date without manual refreshes?
Your sheet updates the same way any formula-based workbook updates: recalculation and the add-in's Refresh button pull the latest data. You can also set Excel to refresh data when opening the file, so your model updates automatically the moment you launch it. This turns your spreadsheet from a static report into a live dashboard.
Can I pull multiple tickers at once for a watchlist or portfolio?
Yes. Put tickers in a range (like A2:A20) and reference that range in your formulas to populate prices, % changes, and other fields in bulk. For example, =FMPPRICE(A2,"Price") can be filled down a column to build a live watchlist in minutes. This is a big upgrade over repeating CSV imports for every symbol.
What's the easiest way to get historical prices for charts and analysis?
Use FMPPRICE with a days argument or a start/end date to return a historical series right into your worksheet. That output can feed Excel charts (line, candlestick, etc.) without any extra steps. If you change the ticker or date inputs, the history updates automatically—no re-downloading files.
Can I pull financial statements and key metrics like revenue, net income, or ROE?
Absolutely. The FMP function pulls fundamentals like income statement items, balance sheet line items, cash flow metrics, and common ratios. You can request a year, trailing twelve months (TTM), last fiscal year (LY), or last quarter (LQ), depending on what you're modeling. Because it's formula-driven, you can drag across tickers and periods.
What's the best way to avoid errors and keep the model maintainable?
Parameterize everything: store tickers, years, and dates in cells, then reference those cells in your FMP formulas. This reduces hard-coded inputs and makes it easy to scale from one ticker to fifty without rewriting formulas. For full statement imports, use the Statement Dump tool to pull complete tables you can reference consistently across the workbook.

Top 5 Defense Stocks to Watch during a Geopolitical Tension
In times of rising geopolitical tension or outright conflict, defense stocks often outperform the broader market as gove...

Circle-Coinbase Partnership in Focus as USDC Drives Revenue Surge
As Circle Internet (NYSE:CRCL) gains attention following its recent public listing, investors are increasingly scrutiniz...

LVMH Moët Hennessy Louis Vuitton (OTC:LVMUY) Financial Performance Analysis
LVMH Moët Hennessy Louis Vuitton (OTC:LVMUY) is a global leader in luxury goods, offering high-quality products across f...

