Best APIs for Advanced Analyst Estimates, Coverage Data, and Forecast Metrics

The best APIs for advanced analyst estimates deliver strictly normalized, integration-ready projections for complex metrics like leverage, multi-year growth, and operating margins directly into quantitative pipelines. While basic earnings per share and revenue figures only define the baseline of market expectations, institutional workflows rely on these deeper layers of financial projections.
These deeper layers include:
- balance sheet projections
- margin and operating forecasts
- coverage depth and participation
- long-term growth assumptions
These datasets are far less standardized and less widely available than basic earnings prints. They are highly dependent on analyst model depth and the level of active street participation. Historically, quants accessed this data exclusively through institutional terminals and enclosed research platforms.
Today, this data is increasingly integrated into models and pipelines through structured data platforms and APIs. The challenge is no longer just access, but working with data that is consistent, normalized, and usable within production systems.
Why Advanced Analyst Estimates Matter in Institutional Workflows
Earnings and revenue equal surface-level expectations. In practice, institutional pipelines ingest advanced metrics like net debt, leverage ratios, and operating margins to automatically stress-test credit models and drive dynamic discounted cash flow valuations. Instead of manually adjusting baseline projections, quantitative teams stream these granular data points directly into algorithmic models to run complex scenario forecasting across thousands of global equities simultaneously. Coverage for these metrics is notoriously uneven across companies and heavily dependent on active analyst participation.
Where Can I Find Consensus Net Debt and Leverage Estimates?
Consensus net debt and leverage estimates are typically available through analyst estimate datasets that extend beyond standard income statement forecasts. Institutional platforms such as FactSet, Refinitiv, and Bloomberg aggregate analyst projections for balance sheet metrics, while platforms like Financial Modeling Prep provide structured financial data that can be directly integrated into leverage and capital structure modeling workflows within institutional systems.
A reliable data source for these balance sheet projections must accurately normalize debt taxonomies across vastly different corporate structures, ensuring net debt means the exact same thing for a bank as it does for a software vendor.
These figures represent forward-looking balance sheet projections, capturing debt minus cash assumptions. Leverage ratios incorporate debt-to-EBITDA and other net debt ratios to define capital structure.
Data sourced from the FMP Key Metrics API highlights this forecast modeling for Nvidia:
- Projected fiscal 2026 net debt to EBITDA ratio sits at 0.0055
- Current ratio is projected at 3.90

This demonstrates effectively zero expected forward leverage for the firm. These metrics are not universally covered across all companies, with stronger coverage existing in large-cap equities. Access depends entirely on individual analyst model participation. Quants rely on this data for credit risk analysis and capital structure modeling. Balance sheet projections provide structural context, but valuation models depend heavily on long-term growth assumptions embedded in analyst forecasts.
What Is a Good Source For Consensus Long-Term Growth Rates?
Consensus long-term growth rates are sourced from analyst estimate platforms that provide forward-looking projections over multi-year horizons, typically spanning three to five years. Institutional providers such as FactSet, Refinitiv, and Bloomberg offer the most consistent coverage, while platforms like Financial Modeling Prep enable these growth assumptions to be integrated directly into valuation models alongside other financial datasets.
Unlike near-term EPS which is heavily guided by corporate management, long-term growth rates are highly subjective and demand deep sector conviction from analysts. They are notoriously harder to model consistently because they require forecasting market expansion, technological shifts, and competitive positioning a half-decade into the future. Small adjustments in these extended assumptions drastically alter terminal value calculations in standard discounted cash flow models.
Data sourced from the FMP Financial Estimates API projects out these exact horizons for Nvidia:
- Average revenue is projected to hit 365.64 billion in fiscal 2027
- Top-line expectations scale up to 480.69 billion by fiscal 2028
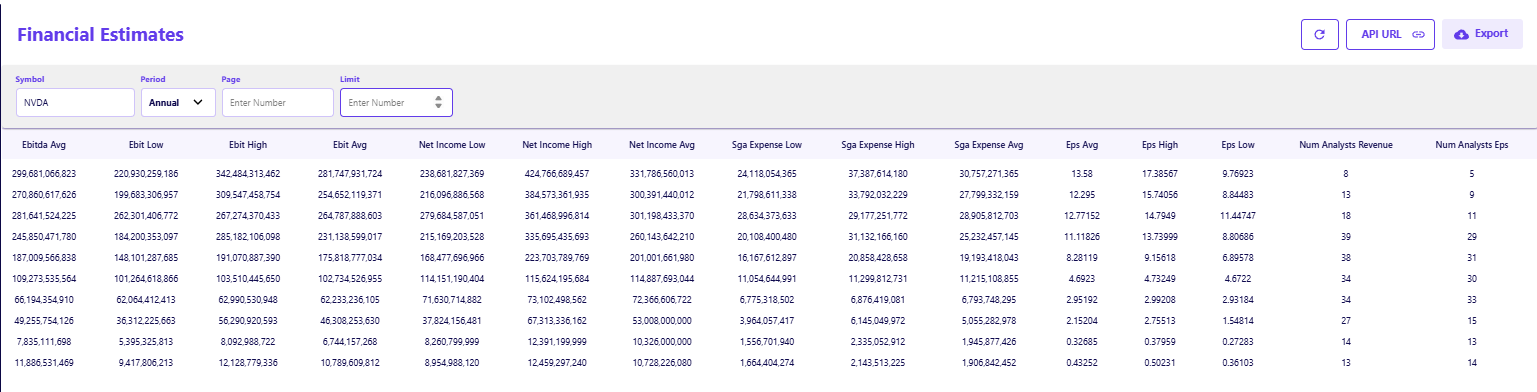
For a quantitative developer, this steep projection curve means internal models must assign a significantly higher terminal growth multiple to this equity to align with street consensus, radically altering the final automated decision output. Not all companies have long-term projections available. Coverage depends entirely on analyst depth and sector maturity. Understanding estimates requires not just the data itself, but also how many analysts are contributing to that consensus.
Where Can I Obtain Historical Analyst Coverage Counts by Company?
Historical analyst coverage counts are available through institutional estimate datasets that track the number of analysts contributing forecasts for each company over time. Platforms such as FactSet, Refinitiv, and Bloomberg include coverage metrics alongside consensus data, while platforms like Financial Modeling Prep provide structured estimate datasets that allow coverage depth to be analyzed and incorporated into modeling workflows.
This metric measures the exact number of contributing analysts and tracks changes in coverage over time. It records the entry and exit of analyst participation across different market cycles. Higher coverage results in a more reliable consensus, while lower coverage creates greater estimate dispersion and higher uncertainty.
Estimate depth sourced from the FMP Financial Estimates API reveals this exact participation curve for Nvidia:
- 38 analysts are contributing to revenue estimates for 2027
- Participation drops to 13 analysts modeling out to 2030
Quants use this explicit drop-off to programmatically decay the confidence weighting of their models. A 2027 revenue forecast backed by 38 analysts is treated as a high-conviction mathematical anchor, whereas a 2030 forecast backed by only 13 analysts is discounted heavily or flagged for manual review due to the structural uncertainty. Beyond coverage and growth, institutional models rely on detailed operating forecasts that extend far beyond headline metrics.
Where Do I Find Consensus Estimates for Margins and Operating Metrics?
Consensus estimates for margins and operating metrics are typically found in institutional platforms like FactSet, Bloomberg, and S&P Capital IQ, or extracted via structured data APIs like Financial Modeling Prep. These sources provide the exact segment-level forecasts, including gross, operating, and EBITDA margins, that quantitative teams need to project future profitability.
Before applying these forward estimates, quants must establish the historical margin baseline using reported filings.
Data sourced from the FMP Latest Financial Statements API allows teams to automate this process:
- Systems pull trailing operating margins to benchmark against forward projections
- Analysts compare this baseline to forward EBITDA consensus to model operating leverage expansion
Institutional platforms provide the deepest model-level detail, while research platforms offer accessible but partial coverage. Structured data platforms deliver integration-ready datasets with the flexibility to build custom margin metrics directly. These margin estimates drive profitability assumptions and are essential for forecasting models. To fully understand analyst expectations over time, these metrics must be tracked historically, particularly at the fiscal-year level.
How Do I Retrieve Historical Consensus Revenue by Fiscal Year?
Historical consensus revenue by fiscal year is primarily available through institutional platforms such as Bloomberg, FactSet, and LSEG Workspace, as well as research datasets like Zacks. Platforms like Financial Modeling Prep provide structured historical financial data that can be aligned with estimate datasets, enabling integration of revenue expectations into time-series modeling workflows.
This data captures aggregated analyst expectations for annual revenue, strictly aligned to company-specific fiscal calendars. Quants use it for long-term modeling and identifying expectation revision trends. Fiscal alignment enables tracking how these expectations change over time against real market movements.
Data sourced from the FMP Historical Price EOD API allows researchers to map these estimate revisions directly to market reactions:
- Nvidia recorded a closing price of 171.24 in late March 2026
- The corresponding volume-weighted average price hit 173.74 on 186.1 million shares traded
Pulling historical stock price data alongside these fiscal targets is critical for backtesting models. This workflow isolates the specific beta-adjusted price movement that occurred the moment the market absorbed the new revenue forecast, allowing developers to programmatically trade future revision momentum over longitudinal studies.
What Differentiates the Best APIs for Advanced Analyst Estimates
High-quality financial APIs provide coverage depth across non-standard metrics, but true differentiation lies in data alignment and handling of revisions. In practice, a subpar API will break quantitative models by mapping forward estimates to the wrong historical fiscal quarter or failing to adjust past consensus figures when a company restates its earnings.
Top-tier providers ensure the availability of:
- leverage ratios
- operating margins
- long-term growth rates
The best APIs prevent pipeline failures by maintaining absolute historical consistency, offering dedicated endpoints for bulk ingestion, and guaranteeing that the data maps perfectly to raw reported financials without requiring internal translation layers. The distinction is not access to estimates, but whether those estimates can be consistently integrated into financial models and production workflows.
How Advanced Estimate Data Fits Into Institutional Modeling Systems
These datasets are never used in isolation. They integrate seamlessly into valuation models, credit risk frameworks, and quantitative forecasting systems. Platforms like Financial Modeling Prep act as a data integration layer. This structured formatting enables scalable ingestion into internal systems and cross-dataset consistency. Before routing forward estimates into a pricing model, quants map the foundational equity parameters.Data sourced from the FMP Company Profile API anchors the entire model setup:
- Nvidia currently operates with a 4.16 trillion market capitalization
- The equity carries a beta of 2.375
Most advanced estimate data exists in the market, but the true challenge is normalization and workflow integration. Determining if a platform is the right tool depends entirely on how well it maps to this existing internal architecture.
Limitations and Practical Breakdowns of Estimate Data
Coverage is uneven across companies and sectors. Many advanced metrics are sparsely available and inconsistently modeled across the street. Long-term growth estimates are highly subjective and infrequently updated compared to quarterly guidance. Margin and operating forecasts lack standardization across different providers. Analyst assumptions can vary significantly, which distorts the final consensus average.
These inherent data limitations cause practical breakdowns within institutional pipelines. Models fail when teams attempt to automatically align estimates across disparate datasets without an overriding mapping logic. Furthermore, algorithms that rely too heavily on specific non-standard metrics often fail during volatile market cycles because the entire system has a heavy dependence on sustained analyst participation to function. When coverage drops or contributors alter their methodologies, the predictive value of the dataset deteriorates rapidly.
Where Advanced Analyst Data Breaks Down in Practice
Models fail when there is inconsistent methodology across analysts. Limited availability of certain metrics forces teams to use proxies or build synthetic variables. The entire system has a heavy dependence on sustained analyst participation to function. There is persistent difficulty aligning estimates across disparate datasets.
How Institutional Teams Evaluate Advanced Estimate Data
Engineering teams evaluate data providers by rigorously testing schema stability across thousands of tickers. They verify fiscal alignment mechanisms to ensure quarter-over-quarter comparisons do not skew. They audit historical normalization logic for survivorship bias to confirm the datasets accurately reflect past market realities. Operational considerations dictate adoption at the enterprise level, requiring scalability across massive equity universes and strict alignment with internal models.
Building a Scalable Advanced Estimate Data Pipeline
A functional pipeline operates as a sequence rather than a static pull. Systems ingest raw feeds, run normalization algorithms to map disparate formats to a standard template, align calendar dates across varying fiscal years, and store the output in a unified database for immediate quantitative querying.
To ensure accurate discounted cash flow valuation modeling, teams must avoid common pitfalls. They cannot mix inconsistent datasets or place an overreliance on incomplete coverage grids.
From Data Access to Model-Ready Infrastructure
Advanced analyst estimates represent the core inputs behind institutional financial models. The differentiator is not who has the data, but who can deliver it in a format that supports rapid modeling, integration, and scale.
The gap between strong and weak providers is measured in engineering hours wasted on data cleaning. The best APIs eliminate translation layers entirely so quantitative teams can focus exclusively on alpha generation. The institutional edge is not defined by access to advanced analyst estimates, but by the ability to integrate, align, and operationalize those estimates within production-grade financial models.
Frequently Asked Questions
What is the difference between consensus estimates and guidance?
Consensus estimates represent the aggregated projections compiled from multiple independent sell-side analysts covering a stock. Guidance is the forward-looking financial projection provided directly by the company management team during earnings calls or official filings.
How often are long-term growth estimates updated?
Long-term growth estimates are typically updated less frequently than quarterly EPS or revenue figures. Analysts generally revise these multi-year projections after major structural changes, annual earnings reports, or significant macroeconomic shifts.
Why do some companies lack consensus margin data?
Companies with low analyst coverage or highly complex operating structures often lack consensus margin data. If the contributing analysts do not publish segment-level or margin-specific models, data aggregators cannot calculate a reliable consensus average.
Can estimate dispersion signal market risk?
High estimate dispersion indicates widespread disagreement among covering analysts regarding a company's future performance. This lack of consensus often signals elevated uncertainty, complex operational transitions, or a higher likelihood of earnings surprises.
Do APIs provide analyst-specific estimates or just the consensus?
Most financial data APIs focus on providing the aggregated consensus estimates to deliver a normalized market view. Accessing individual analyst models usually requires a direct subscription to premium institutional terminal services or specific broker research platforms.

Risk analysis and financial modeling for data-driven market workflows
Parth Sanghvi is a Senior Risk Consultant with experience in financial modeling, valuation, and risk analysis. For FMP, he focuses on translating complex market data and risk models into clear, accessible analysis for developers and investors. His work centers on helping readers understand how institutional-grade financial data applies to real-world workflows and decision-making.
Related




Financial data for every need
Real-time quotes and 30+ years of historical data, including prices, fundamentals, and insider transactions — all accessible via API.
Create Free Account