What Financial Statements Say When Earnings Stay Flat

Flat earnings often create an impression of stability. When net income or earnings per share remains unchanged across reporting periods, the surface interpretation suggests that the business has entered a steady phase.
Financial statements rarely remain static beneath that surface. Revenue mix, margin structure, cash generation, and capital structure can shift materially while reported earnings appear unchanged. These shifts directly affect valuation models, credit assessments, dividend sustainability, and capital allocation decisions. A stable bottom line does not guarantee stable operating fundamentals.
This article builds a structured diagnostic framework using Financial Modeling Prep (FMP) financial statement APIs. We first identify periods where earnings remain flat. We then examine revenue trends, margin behavior, cash flow dynamics, and balance sheet positioning during those same periods. Each step moves from the reported figure to the structural drivers underneath it.
The objective is not to forecast returns or construct a trading signal. The objective is to read financial statements with greater precision. When earnings remain flat, the underlying statements still communicate direction.
FMP API Endpoints Used
This article integrates structured financial statement data from Financial Modeling Prep (FMP). For a foundational overview of financial statement structure and interpretation, see FMP's guide on understanding financial statements. The workflow combines income statement, cash flow statement, and balance sheet data to diagnose structural changes beneath flat earnings.
- Income Statement API: The Income Statement API provides standardized annual and quarterly financial performance data. It includes revenue, gross profit, operating income, net income, and earnings per share.
- Cash Flow Statement API: The Cash Flow Statement API delivers operating cash flow, investing cash flow, financing cash flow, and free cash flow data. It enables evaluation of cash generation relative to reported earnings.
- Balance Sheet Statement API: The Balance Sheet API provides structured data on assets, liabilities, equity, and debt levels. It supports analysis of leverage, liquidity, and capital structure.
- Key Metrics API: The Key Metrics API offers derived financial ratios such as return on equity, return on assets, operating margin, and net profit margin.
How to Get Your API Key
To access Financial Modeling Prep's APIs, you need a valid API key.
Create an account using the official registration page.
After registration, your API key will be available in your dashboard. Replace "YOUR_API_KEY" in the code examples below with your personal key to authenticate requests.
Identifying Flat Earnings Periods
The first step is to identify reporting periods where earnings remain structurally flat. This provides the foundation for all subsequent analysis.
We begin by extracting annual income statement data and constructing a clean dataset focused on net income and earnings per share.
Step 1: Pull Annual Income Statement Data
|
import requests import pandas as pd API_KEY = "YOUR_API_KEY" symbol = "KO" income_url = ( f"https://financialmodelingprep.com/stable/income-statement" f"?symbol={symbol}&period=annual&limit=10&apikey={API_KEY}" ) response = requests.get(income_url) if response.status_code != 200: raise Exception(f"API request failed: {response.status_code} - {response.text}") income_data = response.json() income_df = pd.DataFrame(income_data) income_df.head() |
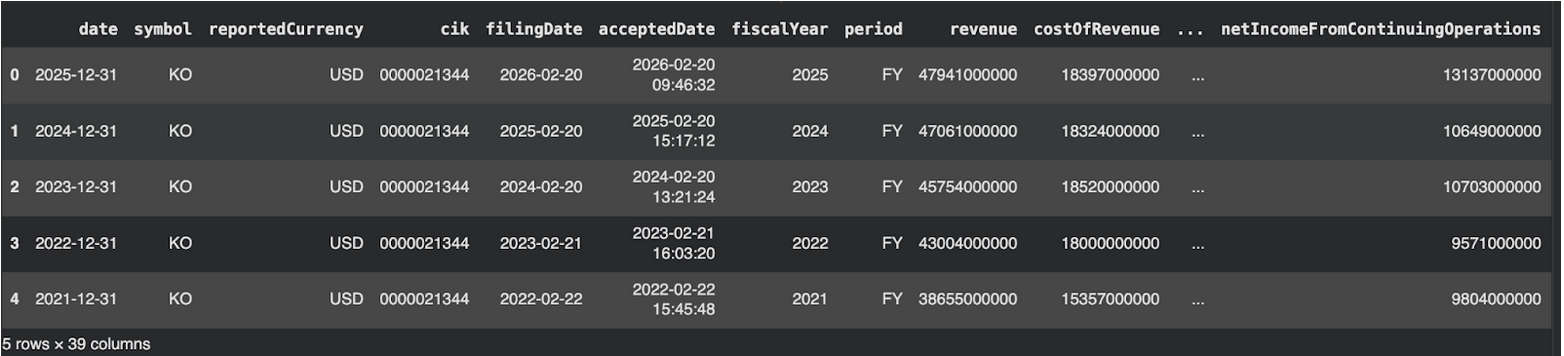
This retrieves annual income statement data for the selected company.
Step 2: Select Core Earnings Fields
|
cols_needed = [ "date", "revenue", "grossProfit", "operatingIncome", "netIncome", "eps" ] income_df = income_df[cols_needed].copy() # Sort chronologically income_df["date"] = pd.to_datetime(income_df["date"]) income_df = income_df.sort_values("date") |
The dataset now contains structured earnings and profitability components.
Step 3: Measure Earnings Stability
Flat earnings are defined here as minimal year-over-year change in net income.
|
income_df["net_income_growth"] = income_df["netIncome"].pct_change() # Define flat earnings threshold (±2%) threshold = 0.02 income_df["flat_earnings_flag"] = ( income_df["net_income_growth"].abs() < threshold ) income_df.tail() |
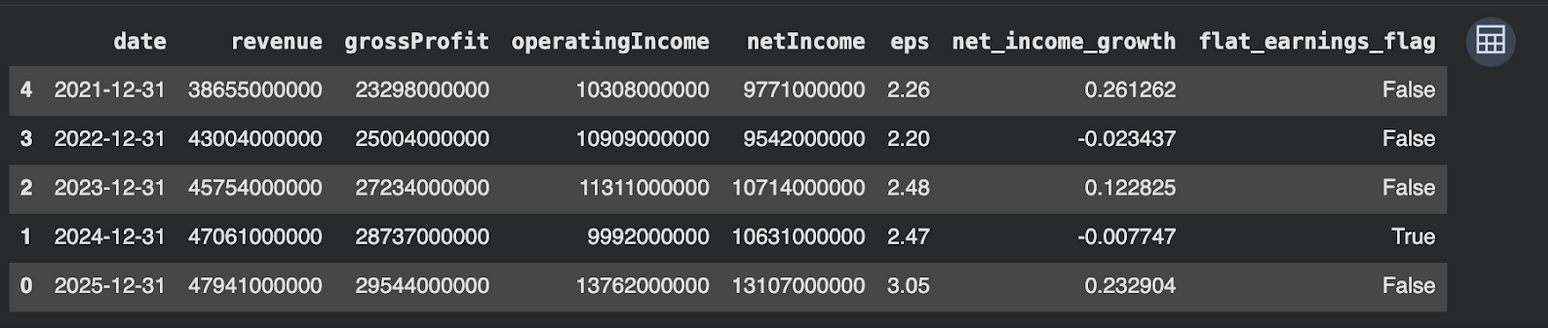
The net_income_growth column measures year-over-year percentage change in net income. A ±2% threshold is used to define structural flatness. This level is intentionally strict: it filters out minor accounting noise and small cyclical fluctuations while still capturing periods where earnings growth is economically negligible rather than meaningfully expanding or contracting.
In the most recent data, 2024 shows a marginal decline of approximately -0.77%, which falls within the defined ±2% threshold. As a result, the flat_earnings_flag is marked True for 2024, indicating structurally flat earnings for that year, while other years exhibit larger movements and are not classified as flat.
Examining Revenue and Margin Structure During Flat Earnings
Once flat earnings periods are identified, the next step is to examine what is occurring within the income statement during those same years. Stability in net income can coexist with meaningful movement in revenue and margins. A structured framework for interpreting income, balance sheet, and cash flow relationships is detailed in FMP's article on how to read a financial statement.
We extend the existing income_df dataset rather than creating a separate structure.
Step 4: Calculate Margin and Revenue Trends
|
# Revenue growth income_df["revenue_growth"] = income_df["revenue"].pct_change() # Margin calculations income_df["gross_margin"] = income_df["grossProfit"] / income_df["revenue"] income_df["operating_margin"] = income_df["operatingIncome"] / income_df["revenue"] income_df["net_margin"] = income_df["netIncome"] / income_df["revenue"] |
These fields describe profitability at different levels of the income statement.
Step 5: Focus Only on Flat Earnings Periods
|
flat_periods = income_df[income_df["flat_earnings_flag"]] flat_periods[[ "date", "netIncome", "revenue", "revenue_growth", "gross_margin", "operating_margin", "net_margin" ]] |

This filtered view isolates the structural conditions present when earnings remain flat.
Under the defined ±2% threshold, only the 2024 reporting period qualifies as structurally flat. All other years show larger year-over-year movements in net income. This indicates that, even for a mature company like KO, earnings stability within a tight ±2% band is relatively rare. The strict threshold classifies flat earnings as an exception rather than a recurring pattern.
In 2024, net income declined marginally by approximately -0.77%, remaining within the flat band. Revenue, however, grew by 2.86% to 47.06B. Gross margin stood at 61.06%, while operating margin measured 21.23% and net margin 22.59%. Revenue expanded modestly, yet profitability ratios did not expand proportionally.
The flat bottom line therefore reflects offsetting forces. Modest revenue growth combined with margin stabilization prevented net income from accelerating. Earnings did not deteriorate materially, but they also did not convert top-line expansion into meaningful bottom-line growth.
Flat earnings in this case represent equilibrium across operating layers rather than operational stagnation.
Evaluating Cash Flow During Flat Earnings Periods
Flat earnings can mask shifts in cash generation. Net income reflects accounting performance, while operating cash flow captures realized cash dynamics. The interaction between income, cash flow, and balance sheet layers is explained further in FMP's guide on three types of financial statements. Examining both provides structural clarity.
We now extend the workflow by pulling annual cash flow data and aligning it with the previously identified flat earnings periods.
Step 6: Pull Annual Cash Flow Data
|
cashflow_url = ( f"https://financialmodelingprep.com/stable/cash-flow-statement" f"?symbol={symbol}&period=annual&limit=10&apikey={API_KEY}" ) response = requests.get(cashflow_url) if response.status_code != 200: raise Exception(f"API request failed: {response.status_code} - {response.text}") cashflow_data = response.json() cashflow_df = pd.DataFrame(cashflow_data) |
Step 7: Select Relevant Cash Flow Fields
|
cashflow_cols = [ "date", "operatingCashFlow", "freeCashFlow", "depreciationAndAmortization" ] cashflow_df = cashflow_df[cashflow_cols].copy() cashflow_df["date"] = pd.to_datetime(cashflow_df["date"]) cashflow_df = cashflow_df.sort_values("date") |
Step 8: Merge Cash Flow with Income Data
|
merged_df = pd.merge( income_df, cashflow_df, on="date", how="left" ) merged_df.tail() |

Step 9: Analyze Cash Flow in Flat Earnings Periods
|
merged_df["cash_conversion_ratio"] = ( merged_df["operatingCashFlow"] / merged_df["netIncome"] ) flat_with_cashflow = merged_df[merged_df["flat_earnings_flag"]] flat_with_cashflow[[ "date", "netIncome", "operatingCashFlow", "freeCashFlow" ]] |

This view allows direct comparison between accounting earnings and realized cash generation.
In 2024, net income stands at approximately 10.63B, while operating cash flow measures 6.81B. The resulting cash conversion ratio is approximately 0.64, meaning that operating cash flow represents about 64% of reported net income. Free cash flow stands lower at 4.74B.
A cash conversion ratio below 1.0 indicates that reported earnings are not fully translating into operating cash during the period. However, this does not automatically imply deterioration. Mature consumer businesses often exhibit working capital timing effects or non-cash accounting adjustments that create temporary gaps between net income and operating cash flow.
To determine whether this divergence is structurally unusual, one would compare the cash conversion ratio across multiple years. If ratios consistently cluster below 1.0, this reflects a stable earnings-to-cash relationship. If 2024 deviates meaningfully from historical levels, the gap would warrant closer scrutiny.
In this instance, flat earnings coexist with moderate cash conversion rather than cash acceleration.
Evaluating Capital Structure During Flat Earnings
Flat earnings can coexist with material changes in leverage and liquidity. The balance sheet provides that context by showing how debt, equity, and cash evolve during the same periods flagged as flat.
This section extends the existing workflow by pulling annual balance sheet data and merging it into the dataset you already built (merged_df).
Step 10: Pull Annual Balance Sheet Data
|
balance_url = ( f"https://financialmodelingprep.com/stable/balance-sheet-statement" f"?symbol={symbol}&period=annual&limit=10&apikey={API_KEY}" ) response = requests.get(balance_url) if response.status_code != 200: raise Exception(f"API request failed: {response.status_code} - {response.text}") balance_data = response.json() balance_df = pd.DataFrame(balance_data) |
Step 11: Select Key Balance Sheet Fields
|
balance_cols = [ "date", "totalDebt", "totalAssets", "totalStockholdersEquity", "cashAndCashEquivalents" ] balance_df = balance_df[balance_cols].copy() balance_df["date"] = pd.to_datetime(balance_df["date"]) balance_df = balance_df.sort_values("date") |
Step 12: Merge Balance Sheet Into the Existing Dataset
|
merged_full = pd.merge( merged_df, balance_df, on="date", how="left" ) |
Step 13: Compute Leverage and Liquidity Indicators for Flat Earnings Years
|
merged_full["debt_to_equity"] = ( merged_full["totalDebt"] / merged_full["totalStockholdersEquity"] ) flat_with_balance = merged_full[merged_full["flat_earnings_flag"]] flat_with_balance[[ "date", "netIncome", "totalDebt", "totalStockholdersEquity", "debt_to_equity", "cashAndCashEquivalents" ]] |

In the 2024 flat earnings period, total debt stands at approximately 45.7B while total equity measures 24.86B, resulting in a debt-to-equity ratio of roughly 1.84x. This indicates that the company operates with nearly twice as much debt as equity during a year of earnings stability.
To interpret this properly, the ratio should be viewed relative to prior years. For mature consumer companies such as KO, leverage levels above 1.0x are not uncommon due to stable cash generation and shareholder return policies. If prior periods show similar debt-to-equity levels, the 1.84x figure reflects structural consistency rather than balance sheet expansion. If materially higher than historical averages, it would suggest incremental leverage accumulation during an otherwise flat earnings year.
Cash balances of approximately 10.83B provide liquidity support. However, leverage remains a defining structural feature of the capital base during this period of reported earnings stability.
Flat earnings in this context coexist with sustained financial leverage rather than capital structure neutrality.
Putting It Together — What Flat Earnings Actually Signal
Flat earnings often appear neutral when viewed in isolation. In KO's 2024 reporting year, net income declined only marginally by approximately -0.77%, qualifying under the strict ±2% definition of structural flatness. At the surface level, this suggests operational steadiness.
The underlying statements describe a more detailed configuration. Revenue increased by 2.86% to 47.06B, yet that expansion did not produce meaningful bottom-line acceleration. Operating cash flow measured 6.81B against 10.63B of net income, resulting in a cash conversion ratio of roughly 0.64. Cash realization therefore trailed reported profitability. At the same time, the balance sheet reflected 45.7B in total debt versus 24.86B in equity, placing leverage near 1.84x.
Viewed together, these layers show interaction rather than inactivity. Revenue growth, margin behavior, working capital effects, and capital structure collectively offset one another. Earnings remained stable not because nothing moved, but because multiple financial forces moved in opposing directions.
For KO, 2024 represents an equilibrium year. The financial statements do not signal deterioration, nor do they signal acceleration. They reveal structural balance across operating performance, cash generation, and leverage.
Flat earnings are therefore not a conclusion. They are a starting point for disciplined structural analysis.
Access to structured income statements, cash flow data, and balance sheet coverage through FMP's APIs is available across flexible subscription tiers detailed on the FMP pricing page.
When Flat Earnings Can Be Misleading
Flat earnings do not always reflect equilibrium. In some cases, they result from financial engineering or accounting effects rather than genuine operating balance.
Share repurchases can offset declining net income by reducing share count, keeping earnings per share stable even if absolute profitability weakens. In such cases, EPS may appear flat while underlying earnings power deteriorates.
One-time items can also distort interpretation. Restructuring charges, asset sales, litigation settlements, or tax adjustments may temporarily inflate or suppress reported income. A single adjustment can create artificial stability across periods that are otherwise volatile.
Changes in accounting standards or revenue recognition policies may affect comparability across years. When reporting frameworks shift, flat earnings may reflect methodological adjustments rather than economic steadiness.
Inflationary environments introduce another layer of complexity. Nominal revenue growth may be driven by pricing rather than volume expansion, while margin compression offsets that growth. Earnings can remain flat even as real purchasing power and operating efficiency shift materially.
Flat earnings therefore require contextual validation. The income statement provides the signal, but footnotes, share count trends, and accounting disclosures determine whether that signal reflects structural balance or temporary masking effects.
Conclusion
Flat earnings can appear uneventful when viewed in isolation. A stable net income figure suggests consistency, yet the broader financial structure often tells a more detailed story.
The income statement identified a year of minimal net income movement. The cash flow statement showed that operating cash generation did not expand at the same pace. The balance sheet reflected a leveraged capital structure during that same period of reported stability.
Taken together, these statements reveal that flat earnings represent a structural configuration rather than simple stagnation. Revenue growth, margin behavior, cash realization, and leverage collectively define the character of that stability.
Financial statements describe composition. Even when earnings remain flat, the underlying structure continues to evolve.

Financial APIs, Claude MCP, and AI-driven research workflows
Pranjal Saxena writes technical content focused on financial data APIs, Claude MCP workflows, AI-driven research systems, and Python-based market analysis. For FMP, his work centers on turning structured financial data into practical, workflow-driven content for developers, analysts, and fintech teams. He combines experience in data science, NLP, generative AI, and financial API workflows to show how APIs, automation, and AI-assisted systems can support modern financial research and analysis.
Related




Financial data for every need
Real-time quotes and 30+ years of historical data, including prices, fundamentals, and insider transactions — all accessible via API.
Create Free Account