Verifying Management Claims Against Reported Financials

Earnings calls play an important role in how companies communicate their performance to investors. During these calls, executives typically highlight the metrics they believe best represent the company's progress, such as revenue growth, margin expansion, cash generation, or balance sheet strength.
Why Verification Matters in Practice
Earnings calls are narrative-driven, and executives often emphasize favorable indicators of performance. As a result, statements such as “strong growth” or “improving margins” may not fully reflect the underlying financial data.
In practice, analysts test whether these claims align with reported results. For example, a company may highlight strong growth, while financial statements show that growth has slowed compared to prior periods. Identifying such gaps helps determine whether the narrative accurately reflects performance.
From Narrative to Measurable Verification
Analysts treat management commentary as a starting point rather than a conclusion. Claims made during earnings calls are tested against reported income statement, cash flow, and balance sheet data.
In this article, we build a verification framework using Financial Modeling Prep data. The workflow retrieves transcripts, extracts measurable claims, maps them to financial metrics, and evaluates whether they are supported, partially supported, or require further interpretation.
Financial Modeling Prep APIs Used
To verify management commentary against reported financial performance, we need two types of datasets. The first is earnings call transcripts, which contain the narrative statements made by company executives. The second is reported financial statement data, which allows us to test whether those statements are supported by the company's actual financial results.
Financial Modeling Prep provides structured APIs for both transcript data and financial statements. By combining these datasets, we can construct a workflow that compares management claims with the company's reported metrics.
Below are the APIs used in this article.
- Earnings Transcript List API: This API returns the available earnings call transcripts for a company, including the fiscal year and quarter associated with each transcript. It helps identify which reporting periods have transcript data available before retrieving the full transcript content.
- Earnings Transcript API: This API retrieves the full text of the earnings call transcript. The transcript contains management commentary that often includes claims related to revenue growth, margin performance, cash flow generation, or balance sheet strength.
- Income Statement API: The income statement provides key profitability metrics such as revenue, operating income, and earnings per share. These metrics allow us to verify management claims related to growth and profitability.
- Cash Flow Statement API: This API provides operating cash flow and free cash flow data, which are commonly referenced when executives describe the company's ability to generate cash.
- Balance Sheet Statement API: Balance sheet data provides information about debt levels, cash reserves, and financial leverage. These metrics allow analysts to verify statements related to financial strength or balance sheet improvements.
How to Get Your API Key
To access Financial Modeling Prep's APIs, you need a valid API key.
Create an account using the official registration page.
After registration, your API key will be available in your dashboard. Replace "YOUR_API_KEY" in the code examples below with your personal key to authenticate requests.
Defining the Verification Workflow
To operationalize this analysis, we construct a verification workflow that connects management commentary from the earnings transcript with the company's reported financial statements.
In this article, the workflow begins with an earnings call transcript and then tests selected management claims against the company's reported financial statements. The objective is not to summarize the call, but to determine whether specific financial statements made by executives are supported by the underlying numbers.
The workflow follows four steps.
First, we retrieve the earnings transcript for a selected reporting period. This gives us access to management's narrative commentary.
Second, we isolate a small set of claims that can be tested quantitatively. The most useful claims are those tied to measurable financial outcomes, such as revenue growth, margin improvement, strong cash generation, or balance sheet strength.
Third, we retrieve the corresponding reported financial data using Financial Modeling Prep statement APIs. This provides the numerical basis for verification.
Finally, we compare the narrative claim with the reported metric and classify the result. In practice, a claim may appear fully supported, only partially supported, or directionally true but lacking important context.
For consistency, we will use a single company and reporting period throughout the article so that each step builds on the same transcript and financial dataset.
|
import requests import pandas as pd API_KEY = "YOUR_API_KEY" symbol = "MSFT" year = 2025 quarter = 2 |
Identifying Available Earnings Call Transcripts
Before retrieving a transcript, we first need to determine which earnings call transcripts are available for the selected company. Earnings calls occur once per quarter, and transcript coverage varies depending on the reporting period and data availability.
Financial Modeling Prep provides an endpoint that lists all available transcript periods for a given company. This allows us to identify the fiscal years and quarters where transcript data exists before requesting the full transcript text.
Using this endpoint ensures that the workflow retrieves a valid transcript rather than attempting to access a reporting period that does not exist.
The following code retrieves the available earnings call transcript dates for the selected company.
|
transcript_dates_url = f"https://financialmodelingprep.com/stable/earning-call-transcript-dates?symbol={symbol}&apikey={API_KEY}" response = requests.get(transcript_dates_url) transcript_dates_data = response.json() transcript_dates_df = pd.DataFrame(transcript_dates_data) transcript_dates_df.head() |
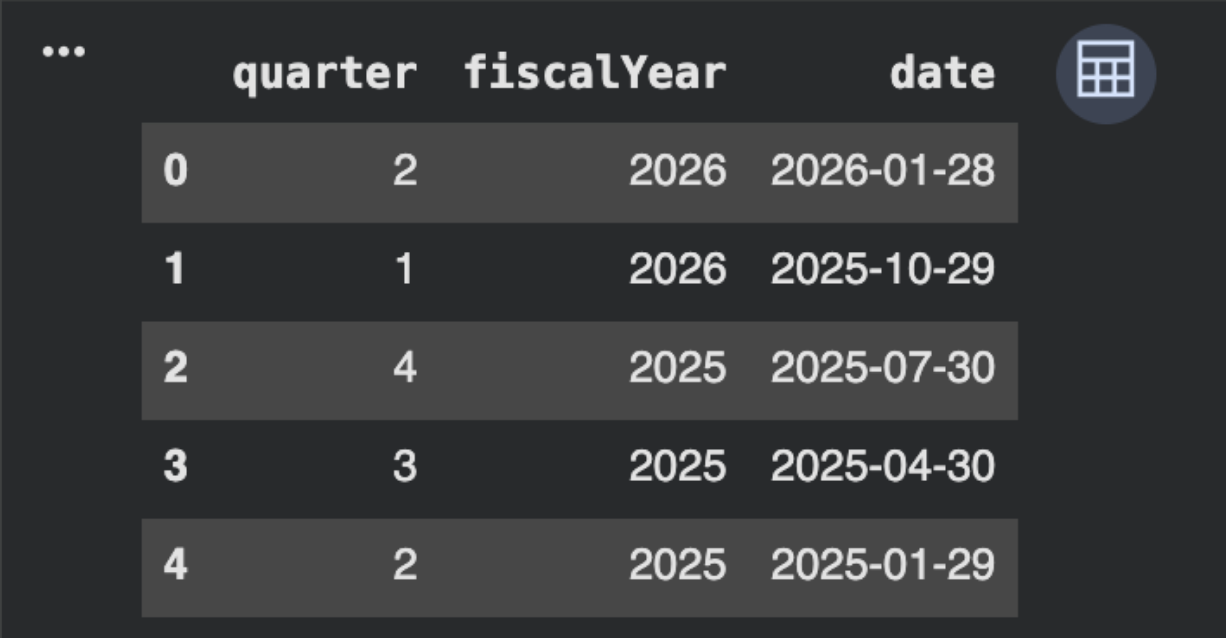
Interpreting Transcript Availability
The dataset lists available earnings call transcripts by fiscal year, quarter, and reporting date. This confirms that multiple recent transcripts are available.
For this analysis, we focus on Fiscal Year 2026, Quarter 2 to ensure alignment with the most recent financial data. Using recent transcripts improves the relevance of the verification exercise.
Retrieving the Earnings Call Transcript
Once we identify a valid reporting period, the next step is to retrieve the full earnings call transcript for that quarter. The transcript contains the narrative discussion delivered by company executives during the earnings call, including commentary on performance, strategy, and financial trends.
Within these discussions, management often highlights specific aspects of company performance. Statements about revenue growth, margin expansion, strong cash generation, or balance sheet improvements frequently appear during the prepared remarks and the question-and-answer session. These statements form the basis for the verification framework built in this article.
Using the reporting period identified in the previous section—Fiscal Year 2026, Quarter 2—we can now retrieve the corresponding earnings call transcript.
|
transcript_url = f"https://financialmodelingprep.com/stable/earning-call-transcript?symbol={symbol}&year={year}&quarter={quarter}&apikey={API_KEY}" transcript_response = requests.get(transcript_url) transcript_data = transcript_response.json() transcript_df = pd.DataFrame(transcript_data) transcript_df.head() |
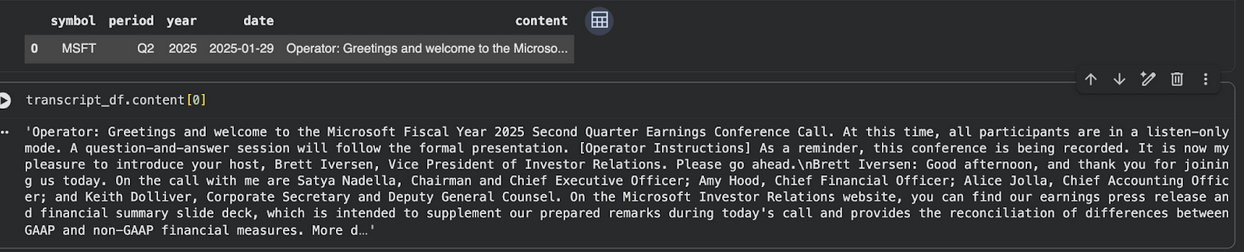
Interpreting the Transcript Data
The content column contains the full transcript text from the earnings call, beginning with the operator introduction and continuing through management's prepared remarks and the subsequent question-and-answer session.
This transcript represents the narrative layer of the company's financial communication. Within the prepared remarks, executives often highlight specific performance indicators such as revenue growth, operating margins, or cash generation. These statements provide useful insight into how management frames the company's performance for investors.
However, narrative commentary alone does not confirm whether these claims fully reflect the underlying financial data. The next step in the verification workflow is therefore to examine the transcript and identify a small number of quantifiable management statements that can be tested directly against the company's reported financial metrics.
In the following section, we will isolate several statements from the transcript that refer to measurable financial performance and prepare them for comparison with the reported financial statements.
Extracting Key Financial Claims
With the earnings call transcript retrieved, the next step is to identify statements made by management that can be tested against reported financial metrics. Earnings call discussions contain a wide range of commentary, including strategic updates, product announcements, and macroeconomic observations. However, not all statements are suitable for verification using financial data.
For this analysis, we focus specifically on quantifiable claims—statements that reference measurable financial performance. These claims typically involve metrics such as revenue growth, operating margins, cash generation, or balance sheet strength. Because these metrics are reported in the company's financial statements, they provide a clear basis for comparison between narrative commentary and reported results.
To locate relevant statements within the transcript, we can scan the transcript text for sentences that contain financial keywords commonly used in earnings discussions.
|
import re transcript_text = transcript_df["content"].iloc[0] keywords = [ "revenue", "growth", "margin", "operating income", "cash flow", "free cash flow", "profit", "earnings" ] sentences = re.split(r'(?<=[.!?]) +', transcript_text) claim_sentences = [ s for s in sentences if any(keyword.lower() in s.lower() for keyword in keywords) ] claims_df = pd.DataFrame({"claim_sentence": claim_sentences}) claims_df.head(10) |
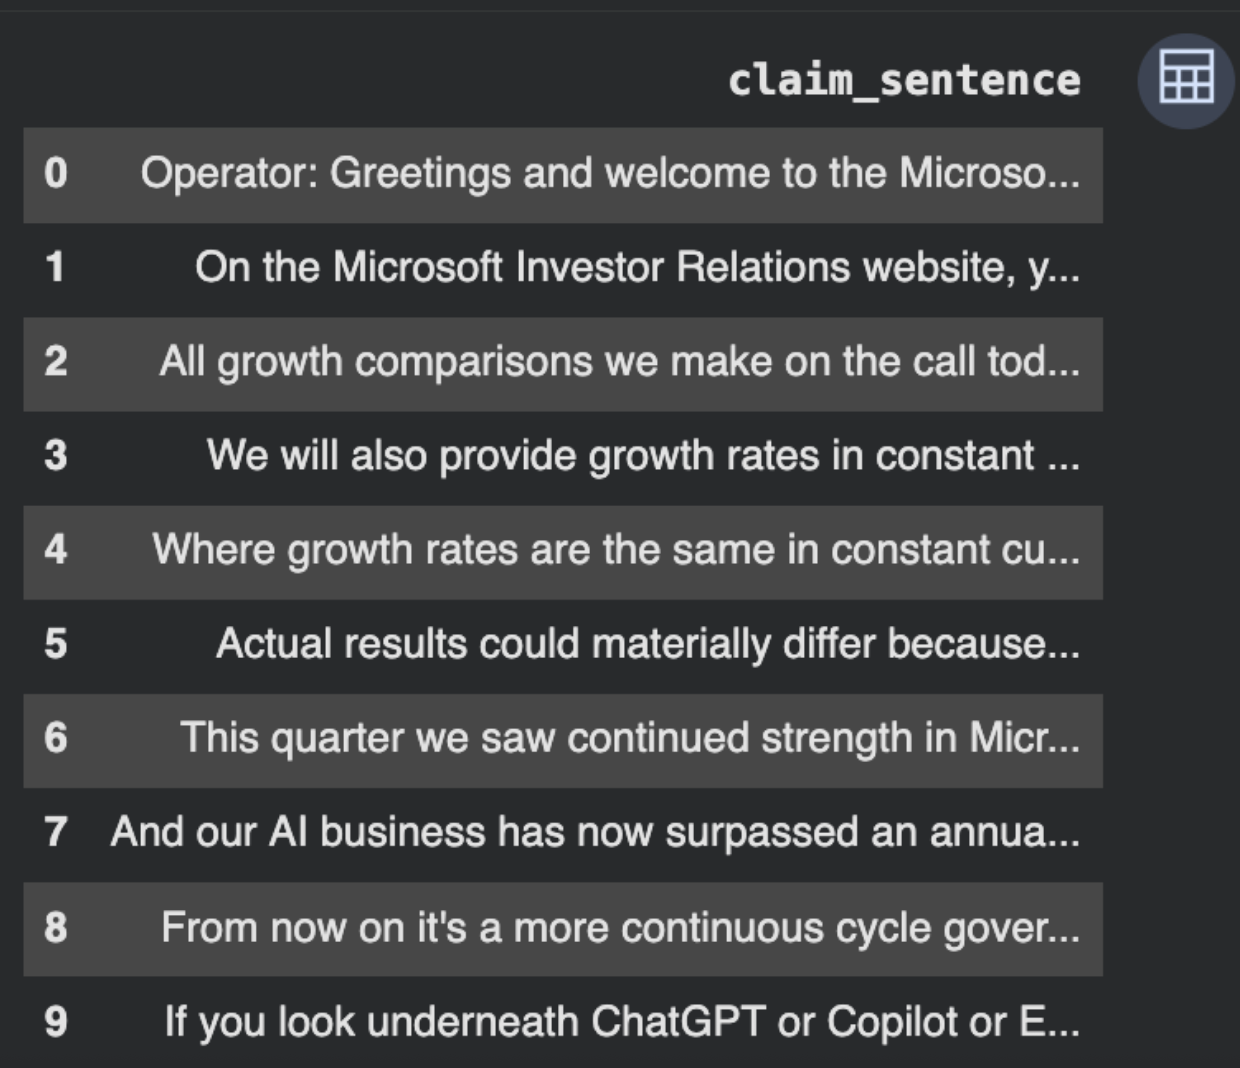
The extracted sentences provide an initial set of candidate statements where management references financial performance. However, keyword-based scanning serves only as a starting point. In practice, analysts typically review these sentences and manually select those that represent clear, measurable financial claims. This step ensures that only statements directly tied to verifiable metrics are included in the analysis, avoiding ambiguity from contextual or non-quantifiable commentary.
Interpreting the Extracted Statements
The extracted dataset contains transcript sentences referencing financial performance. These include themes such as growth, business strength, and segment performance.
However, not all extracted sentences represent clear financial claims. Analysts typically review and select statements tied to measurable metrics, such as revenue growth, margins, cash generation, or balance sheet strength.
Retrieving the Reported Financial Statements
Once relevant management statements have been identified in the earnings transcript, the next step is to retrieve the company's reported financial data. These financial statements provide the numerical foundation required to evaluate whether management commentary aligns with the underlying performance of the business.
For this verification framework, we retrieve three core financial datasets:
- Income statement data, which provides revenue, operating income, and earnings metrics
- Cash flow statement data, which provides operating cash flow and free cash flow values
- Balance sheet data, which provides information about cash balances, debt levels, and financial position
Together, these statements allow analysts to test a wide range of claims commonly made during earnings calls.
Retrieving Income Statement Data
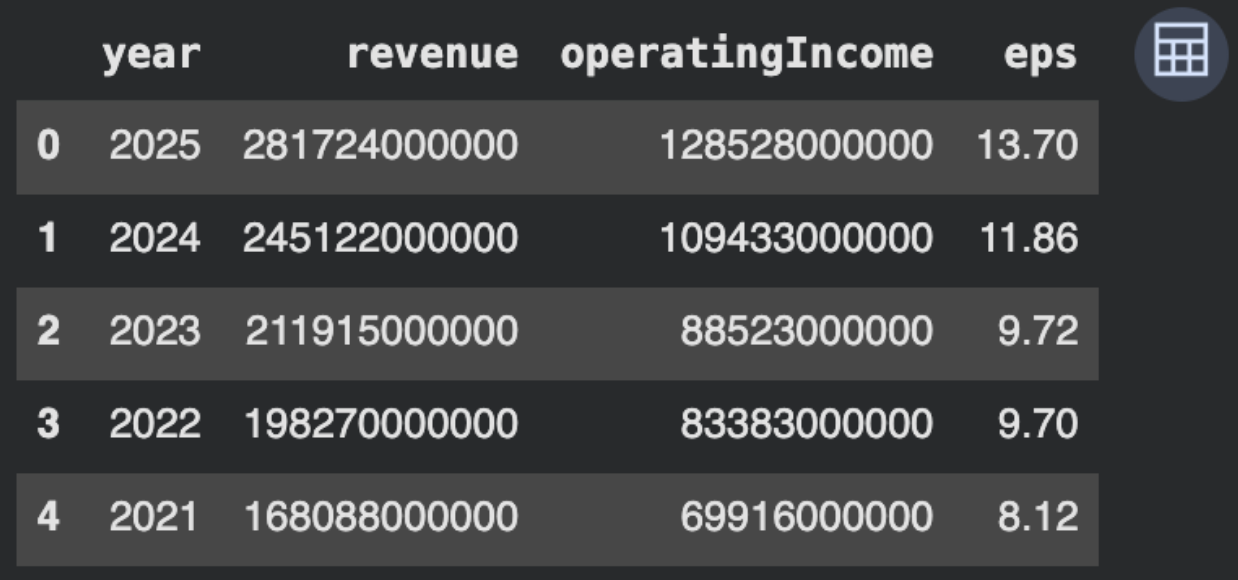
The income statement provides key performance indicators such as revenue growth, operating profitability, and earnings per share. These metrics are frequently referenced during earnings calls when executives discuss the company's operating performance.
|
income_url = f"https://financialmodelingprep.com/stable/income-statement?symbol={symbol}&apikey={API_KEY}" income_response = requests.get(income_url) income_data = income_response.json() income_df = pd.DataFrame(income_data) income_df["date"] = pd.to_datetime(income_df["date"]) income_df["year"] = income_df["date"].dt.year income_df = income_df[["year", "revenue", "operatingIncome", "eps"]] income_df.head() |
Retrieving Cash Flow Statement Data
Many earnings calls highlight the company's ability to generate cash. Free cash flow and operating cash flow therefore play an important role in verifying statements related to financial strength and capital allocation.
|
cashflow_url = f"https://financialmodelingprep.com/stable/cash-flow-statement?symbol={symbol}&apikey={API_KEY}" cashflow_response = requests.get(cashflow_url) cashflow_data = cashflow_response.json() cashflow_df = pd.DataFrame(cashflow_data) cashflow_df["date"] = pd.to_datetime(cashflow_df["date"]) cashflow_df["year"] = cashflow_df["date"].dt.year cashflow_df = cashflow_df[["year", "operatingCashFlow", "freeCashFlow"]] cashflow_df.head() |
Retrieving Balance Sheet Data
The balance sheet provides insight into the company's financial position, including cash reserves and debt levels. These metrics allow analysts to test statements related to balance sheet strength or capital structure.
|
balance_url = f"https://financialmodelingprep.com/stable/balance-sheet-statement?symbol={symbol}&apikey={API_KEY}" balance_response = requests.get(balance_url) balance_data = balance_response.json() balance_df = pd.DataFrame(balance_data) balance_df["date"] = pd.to_datetime(balance_df["date"]) balance_df["year"] = balance_df["date"].dt.year balance_df = balance_df[["year", "cashAndCashEquivalents", "totalDebt"]] balance_df.head() |
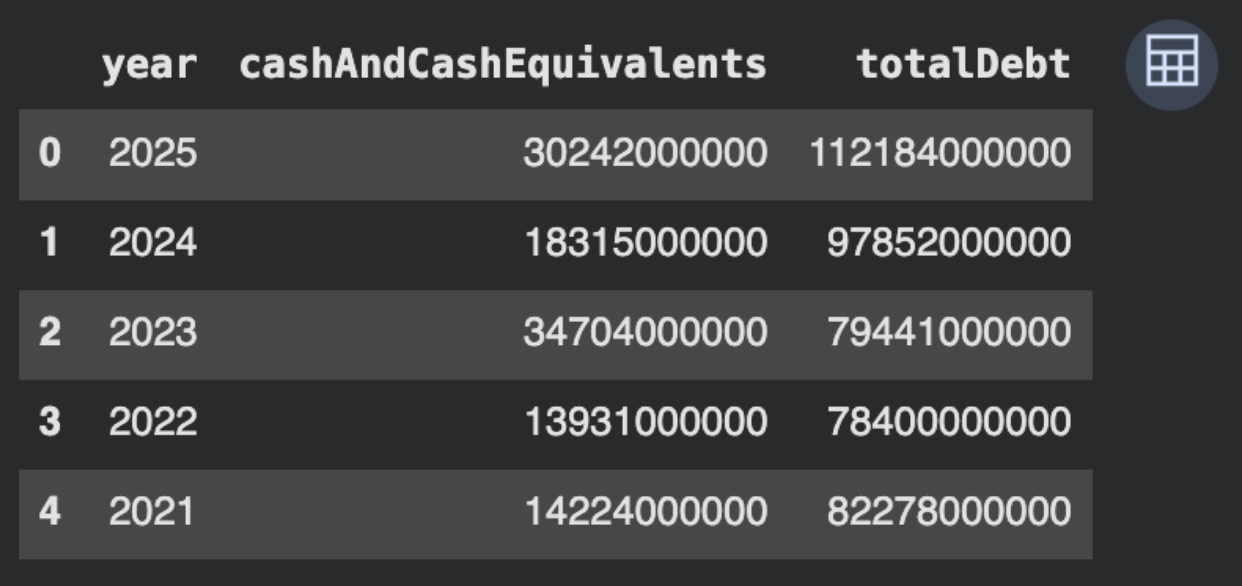
Interpreting the Financial Data
The financial statements provide the quantitative foundation for verification.
Microsoft's revenue increased from approximately $168B in 2021 to over $281B in 2025, while operating income rose from roughly $69B to more than $128B, indicating strong growth and profitability.
Earnings per share also increased, reflecting improved shareholder returns. Cash flow metrics show consistent strength, with operating cash flow rising significantly over the same period.
The balance sheet indicates strong liquidity with stable cash reserves and moderate debt growth.
Together, these metrics allow us to evaluate whether management claims are supported by reported performance.
Building the Claim-Verification Framework
With both the transcript statements and the reported financial metrics available, we can now construct a framework that compares narrative claims with underlying financial data.
Earnings calls often contain broad statements such as “we delivered strong growth”, “cash generation remains robust”, or “profitability continues to expand.” While these statements may accurately describe company performance, they are typically presented without the numerical context required to evaluate their magnitude.
A structured verification framework addresses this gap by mapping narrative statements to the specific financial metrics that support them.
In practice, this process involves three steps:
1. Identify a measurable claim from the transcript.
For example, management might state that the company experienced strong revenue growth or improved profitability during the quarter.
2. Map the claim to the relevant financial metric.
Revenue-related claims correspond to the revenue field in the income statement. Profitability claims correspond to metrics such as operating income or EPS. Cash generation statements correspond to operating cash flow or free cash flow.
- Evaluate the reported data to determine whether the narrative statement is supported by the underlying financial performance.
To operationalize this framework in code, we first organize the financial metrics into a single dataset so that the relevant indicators can be evaluated together.
|
financial_metrics_df = ( income_df .merge(cashflow_df, on="year", how="inner") .merge(balance_df, on="year", how="inner") ) financial_metrics_df |
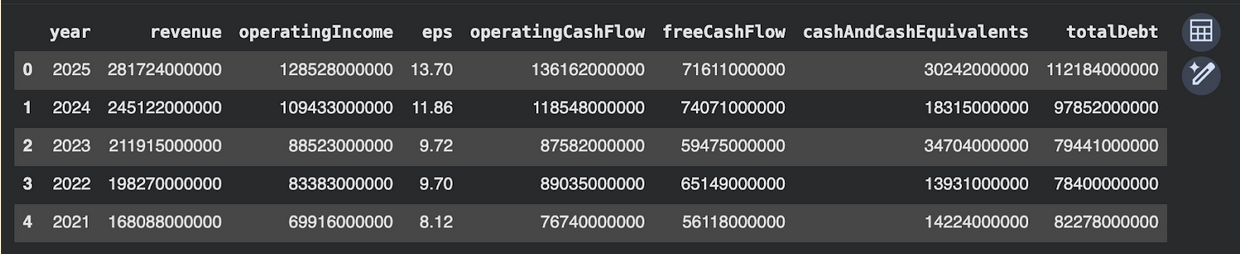
The resulting dataset consolidates the key financial indicators required for claim verification. Revenue, operating income, earnings per share, operating cash flow, free cash flow, and balance sheet liquidity metrics are now available in a single table indexed by fiscal year.
By organizing the data in this format, analysts can directly compare narrative statements from earnings transcripts with the numerical performance indicators reported in the company's financial statements. This consolidated dataset forms the basis for the verification step that follows. It enables analysts to test different categories of transcript claims—such as growth, profitability, cash generation, and balance sheet strength—using a single structured dataset.
Testing a Management Claim Against Reported Results
With the financial metrics consolidated into a single dataset, we can now demonstrate how narrative statements from an earnings call can be evaluated against reported financial performance.
From the extracted transcript statements earlier, several comments referenced continued growth across Microsoft's business segments. While such statements are common in earnings calls, they are often presented in qualitative terms without immediately showing the numerical evidence behind them.
To illustrate the verification process, we can evaluate a simplified version of a common management statement:
“We continue to see strong growth across the business.”
Statements like this are common in earnings calls, where management frequently uses qualitative phrases such as “strong growth,” “solid momentum,” or “continued expansion” to describe performance without immediately providing numerical context.
To test whether this statement aligns with the company's reported results, we examine the company's revenue growth over time. Revenue trends provide a direct indicator of whether the business has experienced sustained expansion.
The following code calculates the year-over-year revenue growth rate using the financial metrics dataset constructed earlier.
|
financial_metrics_df = financial_metrics_df.sort_values("year") financial_metrics_df["revenue_growth"] = ( financial_metrics_df["revenue"].pct_change() * 100 ) financial_metrics_df[["year", "revenue", "revenue_growth"]] |
Output Interpretation
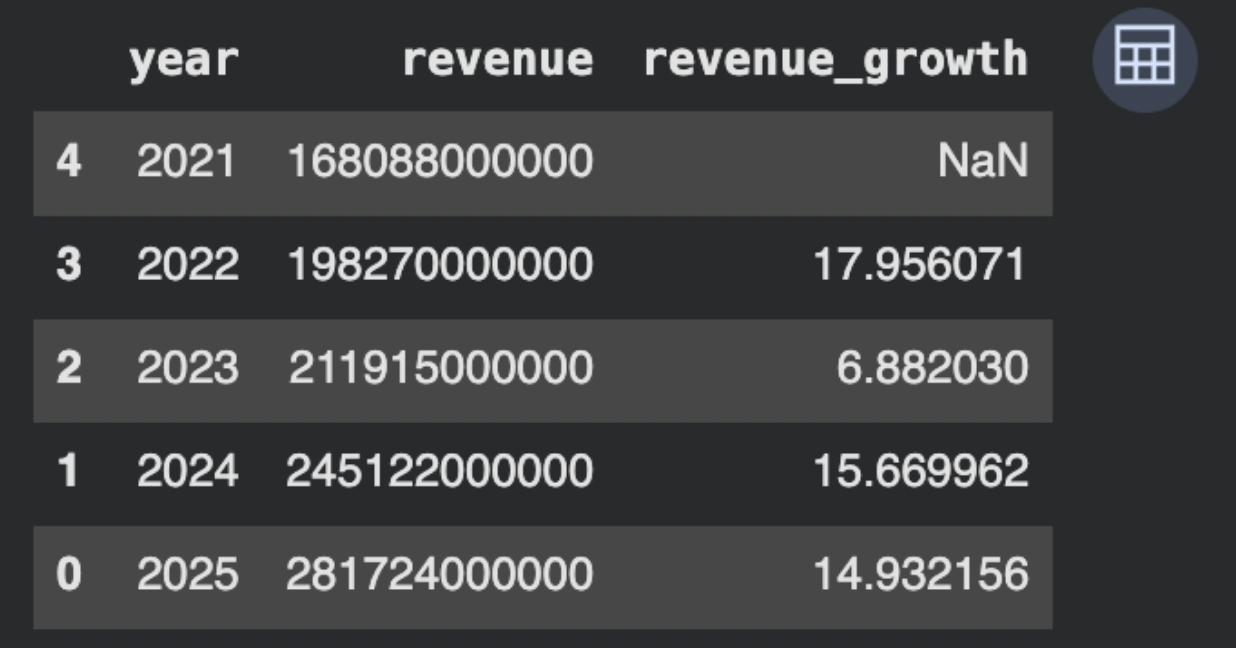
The calculated revenue growth rates provide a clear view of Microsoft's revenue trajectory over the observed period.
Revenue increased from approximately $168 billion in 2021 to more than $281 billion in 2025, indicating substantial expansion in the company's top-line performance. The year-over-year growth rates remain positive throughout the period, with revenue growth of 17.96% in 2022, 6.88% in 2023, 15.67% in 2024, and 14.93% in 2025.
These figures support the narrative statements observed in the earnings transcript describing continued growth across the business. In this case, the financial data aligns with the qualitative commentary provided by management during the earnings call.
More broadly, this example demonstrates how narrative statements can be systematically evaluated using structured financial data. By comparing transcript claims with reported financial metrics, analysts can determine whether the messaging presented during earnings calls accurately reflects the company's underlying financial performance.
Detecting Potential Narrative-Financial Discrepancies
While the previous example demonstrated a case where management commentary aligned with reported financial results, the same verification framework can also be used to identify situations where narrative statements may appear stronger than the underlying financial data.
Earnings calls frequently include statements describing strong momentum, accelerating growth, or continued expansion. However, these descriptions can sometimes obscure changes in the pace of growth when the financial data is examined more closely.
To evaluate this dynamic, we can measure how revenue growth evolves over time. The following code calculates the change in revenue growth between consecutive years.
|
financial_metrics_df["growth_change"] = ( financial_metrics_df["revenue_growth"].diff() ) financial_metrics_df[["year", "revenue_growth", "growth_change"]] |
Measuring changes in the growth rate provides additional insight beyond absolute revenue growth. A company can continue to report increasing revenue while the pace of growth slows materially, which may create a disconnect between management's narrative of strong momentum and the underlying financial trend.
Output Interpretation
The growth_change metric measures how the company's revenue growth rate changes from one year to the next.
The dataset reveals several notable shifts in Microsoft's growth trajectory. Revenue growth reached 17.96% in 2022, but slowed significantly to 6.88% in 2023, producing a −11.07 percentage point change in the growth rate. This indicates that while the company continued to grow, the pace of expansion moderated during that period.
Growth accelerated again in 2024, rising to 15.67%, which represents an increase of approximately 8.79 percentage points compared with the prior year. In 2025, revenue growth remained strong at 14.93%, though the growth rate declined slightly relative to 2024.
This analysis highlights an important distinction. A company may continue to report increasing revenue each year while the rate of growth fluctuates or temporarily slows. When management emphasizes strong momentum during earnings calls, analysts can use this type of analysis to determine whether the financial data reflects accelerating performance or simply continued expansion at varying growth rates.
By systematically comparing transcript statements with reported financial metrics, analysts can identify whether management commentary accurately reflects the underlying financial trajectory or whether additional context is required to interpret the narrative claims.
Mini Case Study: Comparing Management Narrative With Financial Results
To illustrate the verification framework in practice, we can examine a simplified example drawn from the Microsoft earnings transcript used earlier in this analysis.
During the call, management highlighted continued strength across several parts of the business. Statements referencing sustained growth and strong operational performance appeared multiple times throughout the prepared remarks. These statements are typical of earnings calls, where executives summarize the company's performance and strategic momentum for investors.
Using the financial dataset constructed earlier, we can compare this narrative with the company's reported performance metrics.
The revenue data shows that Microsoft's top line increased consistently over the observed period. Revenue expanded from approximately $168 billion in 2021 to more than $281 billion in 2025, reflecting substantial growth in the company's business scale.
Operating income also followed a strong upward trend, increasing from roughly $69 billion in 2021 to over $128 billion in 2025. This indicates that profitability expanded alongside revenue, rather than being driven purely by top-line growth.
Cash flow metrics further support this narrative. Operating cash flow increased from approximately $76 billion in 2021 to more than $136 billion in 2025, while free cash flow remained consistently strong across the period.
Taken together, these figures indicate that the management commentary describing continued strength across the business is supported by the underlying financial data.
This comparison illustrates how transcript commentary can be tested against reported financial results. By combining transcript analysis with financial statement data, analysts can verify whether management claims accurately reflect the company's underlying financial performance.
By combining earnings transcript analysis with structured financial data, analysts can move beyond surface-level statements and evaluate whether management claims accurately reflect the company's reported financial performance.
Final Summary
Earnings calls often present company performance through carefully framed narratives. While these discussions provide valuable strategic context, they frequently rely on qualitative descriptions that may not fully reflect the underlying financial data.
By combining earnings transcript analysis with structured financial statements from the Financial Modeling Prep API, analysts can construct a systematic verification framework. Transcript claims can be extracted, mapped to measurable financial metrics, and tested against reported results.
This approach transforms earnings calls from purely narrative events into structured analytical inputs. Instead of relying solely on management commentary, analysts can directly compare narrative statements with financial performance and identify whether those claims accurately represent the company's reported results. The same framework can also be scaled across multiple companies by programmatically retrieving transcripts and financial data through Financial Modeling Prep APIs, enabling systematic verification across a broader investment universe.
FAQs
1. Why is it important to verify management claims against financial statements?
Earnings calls often present performance using qualitative language such as “strong growth” or “solid momentum.” Verifying these claims against reported financial data helps analysts determine whether the narrative accurately reflects the company's actual performance or requires additional context.
2. Can keyword-based extraction reliably identify all financial claims?
Keyword-based extraction is a useful starting point, but it is not sufficient on its own. Earnings transcripts contain a mix of contextual discussion, forward-looking statements, and qualitative commentary. In practice, analysts review extracted sentences and manually select those that represent clear, measurable financial claims.
3. Which financial metrics are most useful for verifying management commentary?
The most relevant metrics depend on the type of claim. Revenue and growth rates are commonly used to verify expansion-related statements. Operating income and EPS help evaluate profitability claims, while operating cash flow and free cash flow are useful for assessing cash generation. Balance sheet metrics such as cash and debt help verify statements about financial strength.
4. How can this framework be scaled across multiple companies?
The workflow can be automated by retrieving transcripts and financial statements using Financial Modeling Prep APIs for multiple companies. By applying the same extraction and verification logic across a dataset of companies, analysts can systematically identify where management narratives align or diverge from reported financial performance.
5. What are the limitations of this verification approach?
The framework relies on simplified techniques such as keyword-based extraction and direct metric comparison. It may not capture nuanced language, forward-looking guidance, or contextual factors influencing performance. For more advanced analysis, analysts may incorporate natural language processing models and more detailed financial trend analysis.

Financial APIs, Claude MCP, and AI-driven research workflows
Pranjal Saxena writes technical content focused on financial data APIs, Claude MCP workflows, AI-driven research systems, and Python-based market analysis. For FMP, his work centers on turning structured financial data into practical, workflow-driven content for developers, analysts, and fintech teams. He combines experience in data science, NLP, generative AI, and financial API workflows to show how APIs, automation, and AI-assisted systems can support modern financial research and analysis.
Related




Financial data for every need
Real-time quotes and 30+ years of historical data, including prices, fundamentals, and insider transactions — all accessible via API.
Create Free Account