Dividend Sustainability Diagnostic Using Multiple Financial Signals

Dividend-paying stocks often attract investors seeking consistent income and long-term portfolio stability. Companies that maintain reliable dividend programs can signal financial strength, disciplined capital allocation, and confidence in future cash generation.
Why Dividend Signals Can Be Misleading
However, the presence of a dividend alone does not guarantee that the payment is financially sustainable. In practice, investors can misinterpret dividend signals. High dividend yields often emerge when stock prices decline sharply, creating the appearance of an attractive income opportunity even as underlying financial conditions weaken. In other cases, companies may continue paying dividends temporarily despite declining earnings or cash flow, which can mask emerging financial pressure.
Moving Beyond Dividend Yield
Professional analysts therefore evaluate dividends using multiple financial signals rather than relying on yield alone. Key indicators include payout ratios, free cash flow coverage, dividend payment stability, and the company's broader financial position. When these signals are examined together, they provide a more reliable view of whether dividend payments are supported by the company's underlying economics.
What This Diagnostic Framework Produces
In this article, we build a simple dividend sustainability diagnostic using data from Financial Modeling Prep. The workflow retrieves dividend history, earnings data, and cash flow metrics through FMP APIs and combines them into a structured evaluation table. This table integrates three core signals—dividend payment trends, earnings-based payout ratios, and free cash flow coverage—to assess whether a company's dividend program appears financially supported.
Using a real company example, we construct the diagnostic step by step and examine how these financial signals help distinguish between dividends that appear stable and those that may face pressure over time.
Financial Modeling Prep APIs Used
To build a dividend sustainability diagnostic, we need several financial datasets that capture how dividend payments relate to a company's earnings and cash generation. Financial Modeling Prep provides structured APIs that allow us to retrieve this information directly and construct a reproducible analytical workflow.
In this article, we combine dividend history with key financial statement data to evaluate whether dividend payments appear financially supported. The workflow retrieves dividend payments, earnings metrics, and free cash flow data using the following APIs.
- Dividend History API: This API returns historical dividend payment records for a company, including dividend amounts and payment dates. It allows us to analyze how dividend payments have evolved over time and whether the company maintains a stable dividend policy.
- Income Statement API: The income statement API provides profitability data such as revenue, net income, and earnings per share. These metrics help evaluate whether dividend payments are supported by the company's earnings performance.
- Cash Flow Statement API: Dividends are ultimately funded by cash rather than accounting earnings. The cash flow statement API provides operating cash flow and free cash flow data, which allow us to measure whether a company generates enough cash to support its dividend program.
- Key Metrics API: The key metrics API provides calculated financial indicators such as dividend yield, payout ratios, and other performance metrics that help contextualize dividend sustainability within a company's broader financial profile.
How to Get Your API Key
To access Financial Modeling Prep's APIs, you need a valid API key.
Create an account using the official registration page.
After registration, your API key will be available in your dashboard. Replace "YOUR_API_KEY" in the code examples below with your personal key to authenticate requests.
Defining the Diagnostic Workflow
To demonstrate how a dividend sustainability diagnostic can be constructed, we will apply the framework to a real company and evaluate how its dividend payments relate to underlying financial performance.
The objective of the workflow is to combine several financial signals that analysts commonly examine when assessing dividend stability. These signals include dividend payment history, earnings coverage, and free cash flow generation. When evaluated together, these metrics provide a clearer picture of whether dividend distributions appear financially supported.
Throughout this article, we will retrieve the required datasets directly from Financial Modeling Prep APIs and organize them into a structured analysis. The workflow will focus on three primary steps:
- Retrieving historical dividend payments
- Comparing dividends against earnings performance
- Evaluating dividend coverage using free cash flow
For consistency, the analysis will use the ticker symbol Coca-Cola (KO), a company widely recognized for maintaining a long-standing dividend program. Coca-Cola is particularly well suited for this diagnostic because of its stable cash flows, mature capital allocation strategy, and consistent history of dividend payments across multiple economic cycles. Using a well-known dividend-paying company allows us to clearly illustrate how the diagnostic framework operates.
We begin by defining the ticker symbol that will be used in the API requests.
|
import requests import pandas as pd API_KEY = "YOUR_API_KEY" symbol = "KO" |
With the workflow defined, the next step is to retrieve the company's dividend payment history. This dataset will allow us to examine how dividend payments have evolved over time and establish the first signal in the sustainability diagnostic.
Retrieving Historical Dividend Payments
The first component of the diagnostic is understanding how a company's dividend payments have evolved over time. Consistent and gradually increasing dividend payments often indicate financial stability and disciplined capital allocation. Conversely, irregular payments or sudden reductions may signal financial pressure.
Using Financial Modeling Prep's Dividend History API, we can retrieve the complete record of dividend distributions for the selected company.
The dataset includes individual dividend payment events along with their associated dates and payment amounts. Once retrieved, these records can be organized into a structured dataframe for further analysis.
The following Python code retrieves Coca-Cola's historical dividend payments.
|
url = f"https://financialmodelingprep.com/stable/dividends?symbol={symbol}&apikey={API_KEY}" response = requests.get(url) data = response.json() dividends_df = pd.DataFrame(data) dividends_df["date"] = pd.to_datetime(dividends_df["date"]) dividends_df.head() |
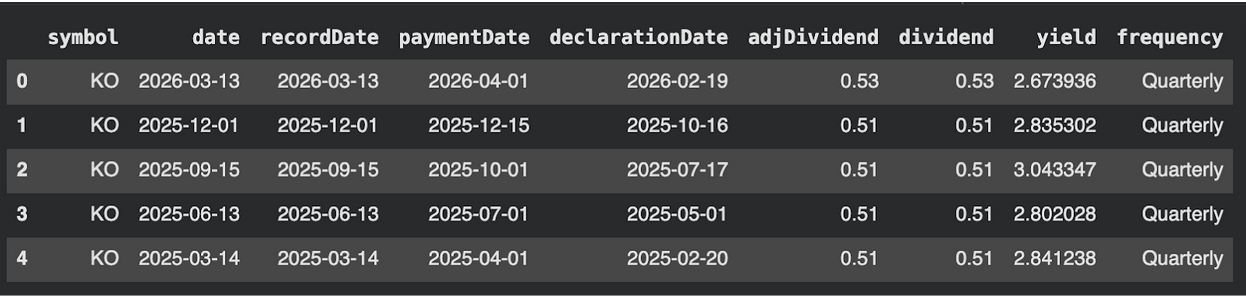
This dataframe gives us the raw dividend payment history for the company, including dates and dividend amounts. However, individual payment events are not the most useful format for evaluating long-term dividend sustainability. Analysts usually convert these records into annual totals so they can study consistency and payout direction over time.
In the next step, we will aggregate these dividend payments into yearly totals, allowing us to evaluate the stability and growth of the company's dividend program.
Constructing Annual Dividend Totals
Individual dividend payment records provide useful detail, but they can be difficult to interpret directly when evaluating long-term dividend behavior. Most companies distribute dividends multiple times per year, which means a single year's dividend may appear as several separate payment events in the dataset.
To evaluate dividend sustainability more effectively, analysts typically convert these individual payments into annual dividend totals. This aggregation provides a clearer view of how dividend distributions evolve over time and helps identify patterns such as steady dividend growth, flat distributions, or potential reductions.
Using the dividend dataset retrieved in the previous section, we can extract the payment year and calculate the total dividends paid in each calendar year.
|
dividends_df["year"] = dividends_df["date"].dt.year annual_dividends = ( dividends_df.groupby("year")["dividend"] .sum() .reset_index() .sort_values("year") ) annual_dividends.tail() |
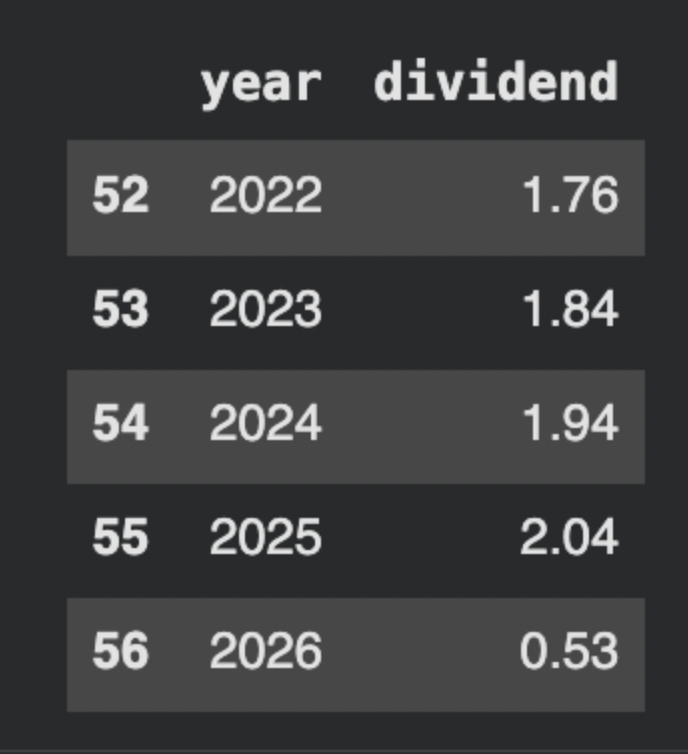
This annual series becomes the first signal in the dividend sustainability diagnostic. The annual dividend series shows a clear pattern of steady and incremental growth over time. Dividend payments increased gradually from 1.76 in 2022 to 2.04 in 2025, indicating a consistent upward trend rather than large or irregular jumps. This type of smooth progression is typically associated with companies that follow a stable and predictable dividend policy.
The 2026 value appears significantly lower because it reflects partial-year payments rather than a complete annual total. When interpreting dividend trends, it is important to distinguish between full-year and partial-year data to avoid misinterpreting temporary drops as changes in dividend policy.
Comparing Dividends with Earnings Coverage
Dividend payments ultimately depend on a company's ability to generate profits. One of the most widely used indicators in dividend analysis is the payout ratio, which measures how much of a company's earnings are distributed to shareholders as dividends.
A very high payout ratio may indicate that a company is distributing most of its earnings, leaving limited room to absorb earnings volatility or invest in future growth. Conversely, a lower payout ratio generally suggests that dividend payments are comfortably supported by profits.
To evaluate this relationship, we retrieve earnings data from the Income Statement API and compare it with the annual dividend totals constructed in the previous section.
Retrieving Earnings Data
The following code retrieves the company's recent income statement data and extracts earnings per share (EPS) values for each fiscal year.
|
income_url = f"https://financialmodelingprep.com/stable/income-statement?symbol={symbol}&apikey={API_KEY}" income_response = requests.get(income_url) income_data = income_response.json() income_df = pd.DataFrame(income_data) income_df["date"] = pd.to_datetime(income_df["date"]) income_df["year"] = income_df["date"].dt.year income_df = income_df[["year", "eps"]] income_df.head() |
Interpreting the Earnings Data
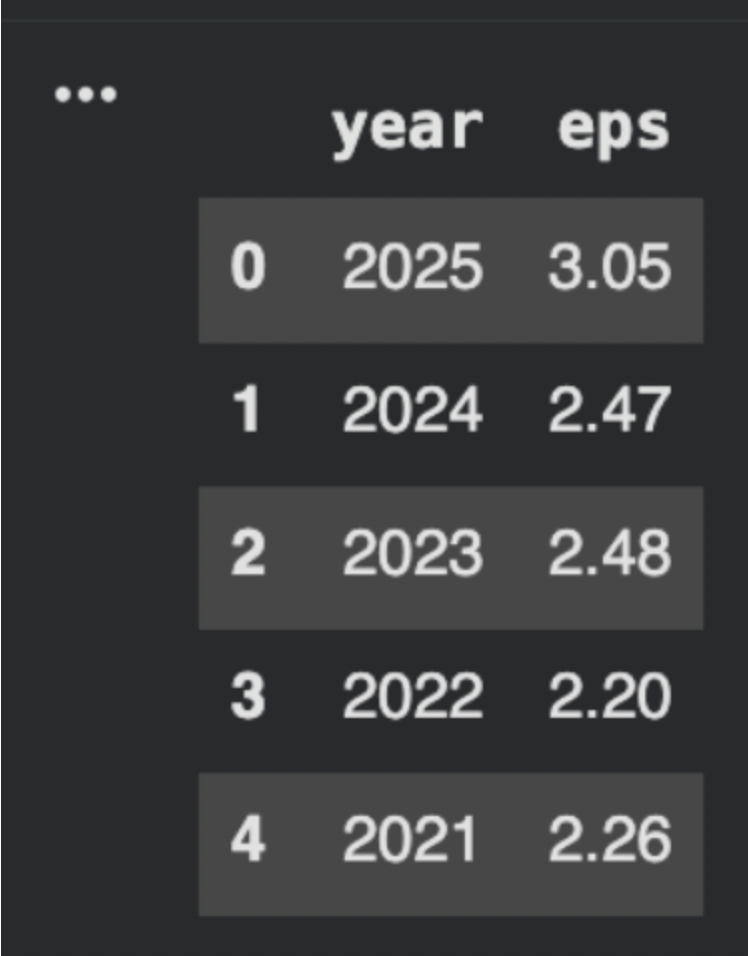
The retrieved dataset shows Coca-Cola's earnings per share across recent fiscal years.
These figures indicate relatively stable earnings generation, with EPS remaining in the roughly $2.20-$3.05 range during the period shown. Stability in earnings is an important prerequisite for sustainable dividends, since consistent profitability supports regular shareholder distributions.
Merging Dividend Data with Earnings
Next, we combine the annual dividend totals with the earnings data. This allows us to estimate how much of the company's earnings are being distributed as dividends.
|
dividend_earnings_df = annual_dividends.merge( income_df, on="year", how="inner" ) dividend_earnings_df["estimated_payout_ratio"] = ( dividend_earnings_df["dividend"] / dividend_earnings_df["eps"] ) dividend_earnings_df |
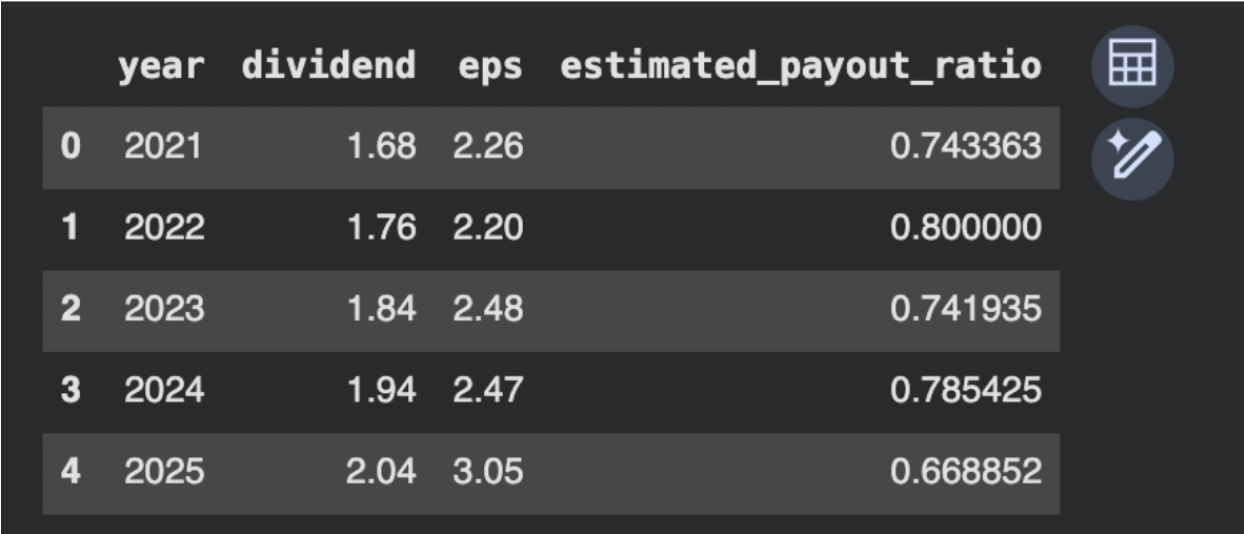
This calculation estimates the payout ratio by dividing annual dividend per share by earnings per share (EPS). It is important to note that this represents an approximate measure of payout ratio rather than the official figure reported by the company, which may incorporate additional adjustments or use different definitions of earnings.
Interpreting the Payout Ratio
Several patterns stand out.
First, Coca-Cola's dividend payments have increased gradually from $1.68 per share in 2021 to $2.04 in 2025, indicating a steady dividend growth pattern. This consistency is characteristic of established dividend-paying companies.
Second, the payout ratio has remained within a relatively stable range of roughly 67% to 80% of earnings. While this level is higher than many growth-oriented companies, it is common among mature consumer companies with predictable cash flows.
Third, the decline in the payout ratio to around 67% in 2025 reflects improved earnings relative to dividend payments. This shift suggests that the company's dividend coverage has strengthened compared with earlier years.
Overall, the earnings-based analysis suggests that Coca-Cola's dividend payments remain well aligned with its profitability, although the payout ratio remains high enough to warrant monitoring.
However, earnings alone do not fully determine dividend sustainability. Dividends are ultimately funded through cash generation rather than accounting profits.
Evaluating Free Cash Flow Coverage
While earnings provide a useful view of dividend coverage, dividends are ultimately funded through cash generation rather than accounting profits. A company may report strong earnings while still experiencing weak cash flows due to working capital changes, capital expenditures, or other financial factors.
For this reason, analysts often evaluate dividend sustainability using free cash flow coverage. This metric compares the cash generated by the business with the dividends paid to shareholders. When free cash flow comfortably exceeds dividend payments, the dividend program is generally considered well supported.
To extend the diagnostic framework, we retrieve free cash flow data using the Financial Modeling Prep Cash Flow Statement API and compare it with the dividend totals constructed earlier.
Retrieving Free Cash Flow Data
The following code retrieves the company's cash flow statement data and extracts the free cash flow values for each fiscal year.
|
cashflow_url = f"https://financialmodelingprep.com/stable/cash-flow-statement?symbol={symbol}&apikey={API_KEY}" cashflow_response = requests.get(cashflow_url) cashflow_data = cashflow_response.json() cashflow_df = pd.DataFrame(cashflow_data) cashflow_df["date"] = pd.to_datetime(cashflow_df["date"]) cashflow_df["year"] = cashflow_df["date"].dt.year cashflow_df = cashflow_df[["year", "freeCashFlow"]] cashflow_df.head() |
Interpreting the Free Cash Flow Data
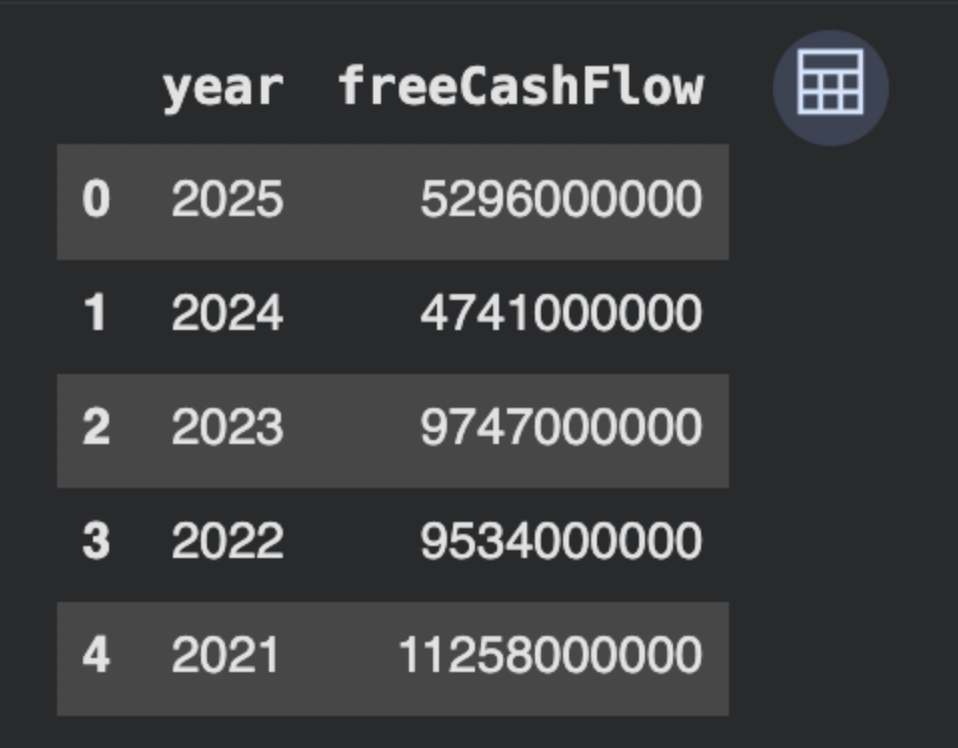
Coca-Cola has generated consistently strong free cash flow, with annual values ranging between roughly $4.7B and $11.3B during the period observed.
The company experienced particularly strong cash generation in 2021-2023, followed by lower but still substantial levels in 2024-2025. Even after this decline, free cash flow remains in the multi-billion-dollar range.
Strong and stable cash generation is an important signal for dividend sustainability because it indicates that the company has the financial capacity to continue distributing cash to shareholders.
Merging Free Cash Flow with Dividend Data
Next, we merge the free cash flow data with the existing dividend and earnings dataset. This allows us to evaluate how comfortably dividend payments are supported by the company's cash generation.
|
dividend_cashflow_df = dividend_earnings_df.merge( cashflow_df, on="year", how="inner" ) dividend_cashflow_df["fcf_dividend_coverage"] = ( dividend_cashflow_df["freeCashFlow"] / dividend_cashflow_df["dividend"] ) dividend_cashflow_df |
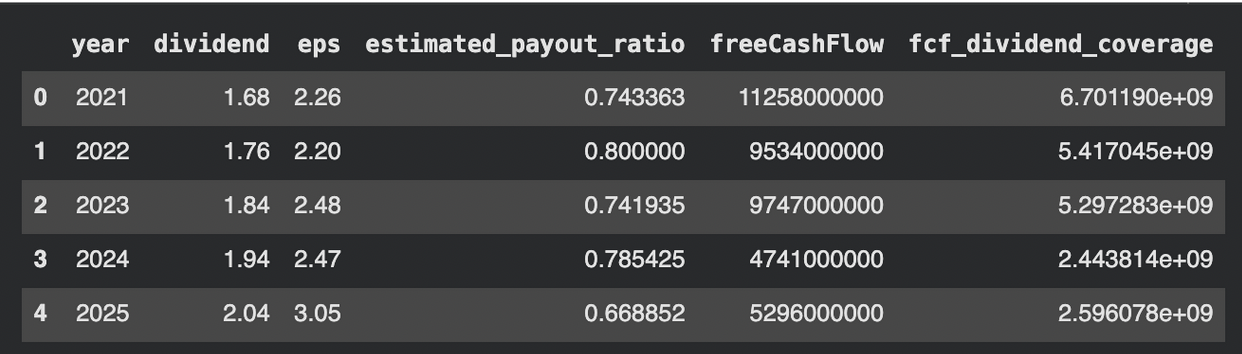
This coverage ratio indicates how comfortably dividend payments are supported by cash generation. Ratios significantly above 1.0 suggest strong coverage, while ratios approaching or falling below 1.0 may indicate potential pressure on dividend sustainability.
Interpreting the Combined Diagnostic Table
The merged dataset now brings together three key signals: dividend payments, earnings coverage, and free cash flow generation. Evaluating these signals together provides a more complete view of dividend sustainability than any single metric alone.
Looking at the combined results, Coca-Cola's dividend profile appears broadly stable. Dividend payments show a consistent upward trend, while payout ratios remain within a manageable range for a mature company. At the same time, free cash flow coverage remains comfortably above dividend levels, indicating that cash generation provides a sufficient buffer to support distributions.
The key insight from the combined view is that all three signals move in a consistent direction. Dividend growth is supported by stable earnings and reinforced by strong cash generation. When these signals align, the likelihood of dividend sustainability is higher than when any one metric shows weakness.
Interpreting the Dividend Sustainability Diagnostic
At this stage of the workflow, the diagnostic combines three core signals into a unified view: dividend payment trends, earnings-based payout ratios, and free cash flow coverage.
Evaluating these signals together provides a more reliable assessment of dividend sustainability than any single metric in isolation. Rather than focusing on individual indicators, the diagnostic highlights whether these signals move in a consistent direction.
In this case, Coca-Cola's dividend profile shows strong alignment across all three dimensions. Dividend payments have increased steadily, earnings coverage remains stable within a manageable range, and free cash flow generation continues to comfortably support distributions. This alignment suggests that the company's dividend program is supported by both profitability and underlying cash generation.
The key takeaway from the diagnostic is not simply that each metric appears favorable, but that the signals reinforce each other. When dividend growth, earnings coverage, and cash flow capacity all remain consistent, the likelihood of dividend sustainability is significantly higher than when these signals diverge.
At the same time, the framework highlights how this assessment should be interpreted. Even when signals appear aligned, dividend sustainability should be evaluated in a broader context that includes industry conditions, capital allocation priorities, and future investment requirements.
Conclusion
Dividend sustainability cannot be evaluated through a single metric. Investors who rely only on dividend yield risk overlooking important financial signals that determine whether dividend payments are genuinely supported by the company's underlying economics.
In this article, we constructed a simple diagnostic framework using Financial Modeling Prep APIs to evaluate dividend sustainability. By combining dividend payment history, earnings coverage, and free cash flow generation, the workflow provides a structured way to examine whether dividend distributions appear financially supported.
Applied to Coca-Cola, the diagnostic highlights a dividend profile characterized by steady dividend growth, manageable payout ratios, and strong free cash flow generation. Together, these signals suggest that the company's dividend program remains supported by its financial performance.
While no single framework can fully predict future dividend decisions, combining multiple financial signals offers a more disciplined approach to evaluating dividend stability. Analysts can extend this workflow to other dividend-paying companies to identify firms whose dividend programs appear well supported by earnings and cash flow dynamics. The same approach can be scaled programmatically by retrieving dividend, earnings, and cash flow data across multiple companies using Financial Modeling Prep APIs, enabling systematic screening of dividend sustainability across a broader investment universe.
Frequently Asked Questions (FAQs)
1. Why is dividend yield alone not sufficient to evaluate dividend sustainability?
Dividend yield can be misleading because it often increases when a stock price declines, which may signal underlying financial weakness rather than an attractive income opportunity. A high yield does not necessarily indicate that the dividend is well supported by earnings or cash flow.
2. What is the difference between payout ratio and free cash flow coverage?
The payout ratio measures how much of a company's earnings are distributed as dividends, while free cash flow coverage evaluates whether the company generates enough actual cash to fund those payments. A company may have acceptable earnings coverage but still face dividend pressure if cash flow is weak.
3. Why is free cash flow considered more important than earnings for dividend analysis?
Dividends are paid using cash, not accounting profits. Free cash flow reflects the actual cash available after operational and capital expenses. Strong and consistent free cash flow provides a more reliable indication of a company's ability to sustain dividend payments.
4. What does it mean if the dividend coverage ratio approaches or falls below 1.0?
A coverage ratio near or below 1.0 indicates that the company's cash generation is barely sufficient—or insufficient—to support its dividend payments. This may signal potential risk to dividend sustainability, especially if the trend persists over multiple periods.
5. How can this dividend sustainability framework be applied to multiple stocks?
The workflow can be automated by retrieving dividend history, income statement data, and cash flow data for multiple companies using Financial Modeling Prep APIs. By applying the same calculations across a set of dividend-paying stocks, analysts can systematically screen for companies with strong or weak dividend sustainability profiles.

Financial APIs, Claude MCP, and AI-driven research workflows
Pranjal Saxena writes technical content focused on financial data APIs, Claude MCP workflows, AI-driven research systems, and Python-based market analysis. For FMP, his work centers on turning structured financial data into practical, workflow-driven content for developers, analysts, and fintech teams. He combines experience in data science, NLP, generative AI, and financial API workflows to show how APIs, automation, and AI-assisted systems can support modern financial research and analysis.
Related




Financial data for every need
Real-time quotes and 30+ years of historical data, including prices, fundamentals, and insider transactions — all accessible via API.
Create Free Account