How Can I Access Analyst Estimates and Price Targets Programmatically?

Financial teams and developers must retrieve analyst estimates and price targets programmatically to power automated valuation models, internal dashboards, and dynamic portfolio monitoring systems. Relying on manual terminal pulls creates latency and limits the ability to scale analysis across vast equity universes.
This page explains how to access, structure, and operationalize consensus forecasts, rating data, and price target distributions directly via API. By integrating these structured datasets into internal systems, quantitative researchers and developers can establish benchmark expectations for equity performance and automate risk management frameworks.
In institutional workflows, these datasets are continuously ingested and recomputed within models, allowing systems to track how expectations evolve as new analyst inputs are published.
What Types of Analyst Data Can Be Accessed Programmatically?
Programmatic endpoints deliver the core outputs of sell-side research directly into analytics pipelines, encompassing consensus EPS and revenue estimates, price target distributions, recommendation ratings, and revision histories. These datasets form the foundation for institutional valuation models and systematic sentiment analysis workflows. Understanding the specific nuances of these structured outputs is the first step in building reliable data architectures.
In practice, these datasets are ingested programmatically and linked across systems, allowing analysts to move from static data points to continuously updated signals within valuation and monitoring frameworks.
Consensus EPS and Revenue Estimates
Quarterly and annual forecasts form the baseline for fundamental market expectations. Consensus aggregation averages individual analyst models into a single expected value. Markets price equities based on these consensus expectations, making them a primary input for earnings surprise models.
Analyst Price Targets
Price targets represent an analyst calculation of fair value over a specific time horizon, typically twelve months. Tracking the target high, target low, and the consensus median across the street provides a clear distribution of valuation sentiment. Integrating this distribution into risk models allows teams to programmatically flag equities trading outside established fair value bands.
These signals are typically generated automatically by systems that ingest price target distributions via API and evaluate them against real-time market prices.
Recommendation Ratings
Research analysts assign categorical ratings such as buy, hold, or sell to indicate their structural view on a security. Normalizing these ratings into numeric scores enables internal systems to trigger automated alerts when a core holding experiences street-wide downgrades.
Estimate Revisions
Analysts constantly update their forecasts to reflect macroeconomic shifts or management guidance. Tracking estimate revisions systematically identifies the directionality of street sentiment over time. A consistent pattern of upward revisions often serves as a bullish momentum signal within quantitative models.
Analyst Coverage Data
Coverage data tracks the absolute number of analysts publishing estimates for a specific company. Breadth of coverage correlates directly with institutional liquidity and pricing efficiency. Screening for coverage breadth allows developers to filter out thinly traded equities with high estimate dispersion before feeding data into internal portfolio builders.
How Analyst Estimate Data Is Structured in Financial APIs
Financial APIs deliver estimate data in machine-readable formats like JSON or CSV to facilitate immediate database ingestion. The payload structure hinges on universal company identifiers such as ticker symbols or CUSIPs to ensure mapping accuracy across disparate internal systems.
These APIs act as the ingestion layer for analyst estimate data, enabling systems to retrieve, store, and update consensus metrics and estimate distributions at scale without manual intervention.
A standard programmatic response organizes this data systematically using specific structural elements:
- Company identifiers for cross-system mapping
- Fiscal periods separating quarterly expectations from annual projections
- Consensus averages alongside high and low distribution boundaries
- Precise timestamps recording when the estimate was published or updated
Timestamps are the most critical structural component of any historical estimate dataset. Accurate timestamps allow quants to map exactly when a consensus figure changed. This precision is necessary to avoid look-ahead bias during backtesting, ensuring models only trade on data that was actually public at the time
In systematic workflows, timestamped data allows models to reconstruct exactly what the market expected at any given point in time, forming the foundation for reliable backtesting and signal validation.
Once analyst estimate data is structured and accessible, the next step is understanding how these datasets are retrieved programmatically and integrated into financial systems.
How Do You Access Analyst Estimates and Price Targets Programmatically?
Accessing this data programmatically requires moving from graphical terminal interfaces to structured query workflows. The process begins with establishing a secure connection to a data provider and configuring the ingestion pipeline.
In production environments, this process is automated through scheduled data pipelines that continuously query APIs, ensuring that analyst estimates and price targets remain current across internal systems.
The standard workflow involves several sequential steps to ensure clean data delivery:
- Selecting a financial data API that aggregates consensus metrics
- Authenticating requests via a secure API key assigned to your system
- Querying specific analyst estimate endpoints using ticker and period parameters
- Retrieving the structured JSON or CSV data payloads
- Parsing and normalizing the outputs for internal database storage
Internal systems translate these raw responses into usable metrics for analytics platforms. Querying Apple projections for fiscal 2030 reveals a consensus revenue estimate of 581.68 billion and an average EPS of 13.33, sourced directly from the Financial Estimates API. In practice, this type of query is executed continuously across thousands of tickers, allowing systems to update valuation inputs dynamically rather than relying on static snapshots.
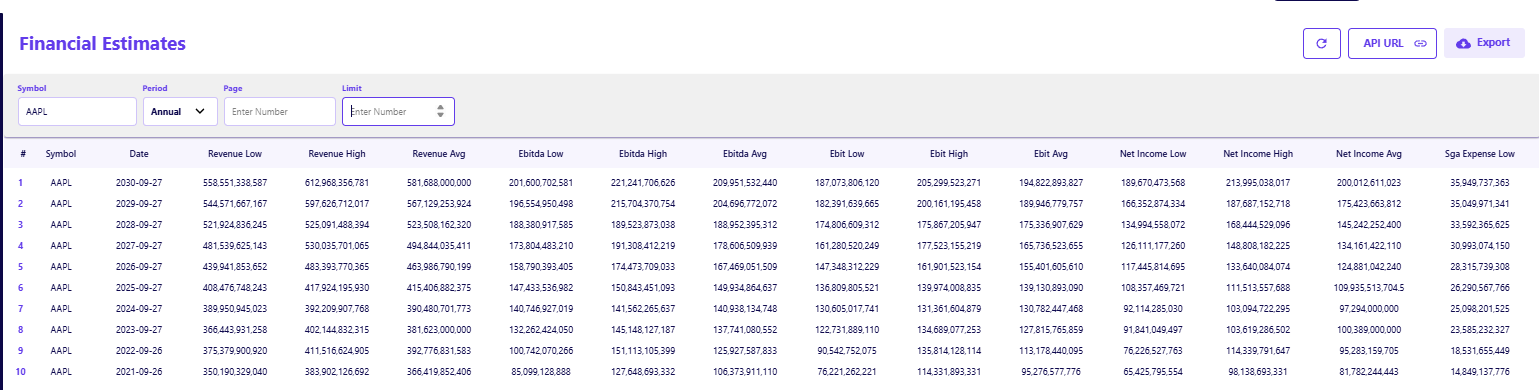
Extracting forward-looking consensus averages directly via API allows quantitative teams to feed automated valuation models without manual intervention.
How are analyst price targets retrieved via API?
Analyst price targets are retrieved by calling specific consensus endpoints that return a structured distribution of street estimates, capturing the highest, lowest, and median values for a given ticker. Engineers configure retrieval scripts to query these endpoints dynamically, extracting the normalized target metrics for immediate storage. Querying Apple data shows a target consensus of 316.36, framed by a street high of 350 and a low of 239, sourced from the Price Target Consensus API.
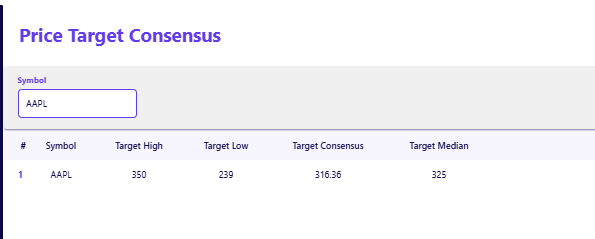
Tracking how these distributions change over time allows systems to detect shifts in analyst conviction, turning price targets into a dynamic signal rather than a static reference point. Aggregating historical target distributions allows internal analytics platforms to maintain accurate sentiment gauges over time.
Looking at historical breadth through the Price Target Summary API reveals data points like 232 all-time price target records for a ticker, with a recent monthly average target of 330. This structured retrieval ensures risk models reflect current street expectations instead of stale inputs.
How are analyst ratings structured and normalized across providers?
Analyst ratings are structured as standardized numeric scores or aggregated letter grades within APIs to normalize the disparate, proprietary terminology used across different brokerage firms. Discretionary analysts reading broker notes on Bloomberg, FactSet, or LSEG encounter a mix of terms like overweight, market perform, or sector weight. Programmatic feeds run these raw textual ratings through internal mapping tables to translate them into a unified scale for aggregation.
Structured endpoints simplify this ingestion by delivering aggregated scores directly, bypassing the need for complex internal normalization engines. These standardized outputs allow internal systems to monitor rating changes in real time and trigger alerts or portfolio adjustments based on shifts in analyst sentiment.
An equity might hold a B rating paired with a discounted cash flow score of 3, sourced from the Ratings Snapshot API. Feeding these structured metrics directly into portfolio monitoring systems alerts risk managers when a core holding experiences analyst deterioration.

Building Financial Workflows with Programmatic Analyst Data
Programmatic access allows teams to operationalize analyst data directly within internal systems. Discretionary analysts rely heavily on institutional platforms to read detailed qualitative broker notes and examine individual analyst assumptions. Quantitative researchers and developers require structured pipelines to ingest these consensus figures at scale across thousands of tickers simultaneously.
These workflows are typically driven by API-based ingestion pipelines that continuously update analyst data inputs, ensuring that models and dashboards reflect the most current market expectations.
Data engineers build scalable systems that apply analyst data across several critical workflows:
- Automatically fetching consensus EPS and revenue estimates prior to earnings calls
- Feeding internal dashboards that track actual reported figures against established street expectations
- Calculating dynamic forward earnings multiples within automated valuation pipelines
- Generating algorithmic trading signals based on estimate revision momentum
This programmatic approach ensures that risk models, trading strategies, and internal research platforms react immediately to shifting consensus without requiring manual data entry. It transitions analyst estimates from passive reference points into active operational triggers.
Using Financial Modeling Prep to Access Analyst Estimates and Price Targets
Executing this workflow requires a reliable data layer. Financial Modeling Prep serves as this data layer by providing structured, programmatic access to analyst estimates, price targets, and ratings that can be directly integrated into internal systems and analytical workflows.
Developers utilize these endpoints to bypass manual data aggregation and feed consensus metrics straight into application databases. The platform delivers programmatic access to forward-looking financial estimates, price target consensus distributions, and normalized recommendation ratings.
Analyst price targets and recommendation ratings are retrieved via API endpoints that return structured distributions of analyst expectations, including consensus, high, and low targets, along with aggregated rating classifications. These datasets represent point-in-time sentiment indicators rather than forward financial forecasts.
Financial Modeling Prep enables teams to retrieve analyst estimate and price target data programmatically and integrate it directly into internal financial models, analytics platforms, and research systems. Review the Financial Estimates API documentation to see how structured consensus payloads map to your existing valuation models. This infrastructure layer allows enterprise teams to connect forward-looking market expectations seamlessly with historical financial statement data.
System Synthesis and Forward Path
Programmatic retrieval of market expectations replaces fragile manual processes with scalable, automated data architecture. These datasets are most effective when used together. Consensus estimates provide baseline expectations, price targets reflect valuation outlook, and rating changes signal shifts in analyst sentiment, all of which can be integrated into unified financial modeling and monitoring systems. Engineering these workflows correctly allows investment teams to deploy faster sentiment signals, build more responsive valuation models, and maintain rigorous portfolio monitoring architectures.
In modern financial systems, these datasets are continuously ingested, recalculated, and monitored, allowing teams to track not just what the market expects, but how confident those expectations are over time.
Frequently Asked Questions
What is the difference between consensus estimates and individual analyst estimates?
Consensus estimates represent the mathematical average or median of all individual analyst forecasts covering a specific stock. Individual estimates reflect the specific modeling assumptions of a single analyst at a particular research desk.
Why is timestamp accuracy important when retrieving analyst estimates?
Accurate timestamps prevent look-ahead bias in quantitative modeling. They ensure that a backtest only utilizes the estimate data that was publicly available at the exact moment a historical trade simulation occurs.
How do estimate revisions impact quantitative trading models?
Estimate revisions signal a change in fundamental expectations, often driven by new macroeconomic data or corporate guidance. Quantitative models ingest these revisions to generate momentum signals based on the velocity and direction of the updates.
Can I use programmatic price targets for backtesting?
You can use programmatic price targets for backtesting provided the API supplies historical target distributions with accurate point-in-time timestamps. This setup allows quants to test strategies based on the spread between the current market price and the consensus target.
How do data pipelines handle different analyst rating scales?
Brokers use different terminology for their ratings such as buy versus overweight or market perform. Data pipelines must run these raw textual ratings through internal mapping tables to translate them into a standardized numeric scale for aggregation.

Risk analysis and financial modeling for data-driven market workflows
Parth Sanghvi is a Senior Risk Consultant with experience in financial modeling, valuation, and risk analysis. For FMP, he focuses on translating complex market data and risk models into clear, accessible analysis for developers and investors. His work centers on helping readers understand how institutional-grade financial data applies to real-world workflows and decision-making.
Related




Financial data for every need
Real-time quotes and 30+ years of historical data, including prices, fundamentals, and insider transactions — all accessible via API.
Create Free Account