How to Track Company Headcount and Workforce Changes with a Free API

Workforce size is often a lagging indicator of financial health but a leading indicator of operational capacity. A company rapidly adding thousands of employees is signaling growth and capital investment, while a stagnation or decline in headcount often precedes restructuring or cost-cutting measures. For analysts, tracking this metric provides a sanity check on management's growth narratives.
However, employee data is typically updated only once a year in 10-K filings, making it difficult to track actively without manually parsing regulatory documents. Using a free Company Employee Count API allows you to standardize this collection process. By pulling structured headcount data programmatically, you can instantly compare a company's current scale against its historical baseline or its peers, ensuring your operational assumptions align with reality.
Getting Started: Obtaining Your Free API Key
Before you can pull workforce data programmatically, you need to establish a connection. This requires an API key, which acts as your unique digital ID for making requests.
Getting set up is straightforward:
- Navigate to the Financial Modeling Prep pricing page.
- Locate the "Free" plan option and click "Get my free API key."
- Enter your email to start the registration process—no credit card is required.
- Once verified, your unique API key will be displayed on your dashboard.
This key allows you to make immediate calls to the API. For a more detailed walkthrough on setting up your environment, you can refer to this guide on how to sign up and use a free stock market data API.
Accessing Current Workforce Scale
The starting point for operational analysis is understanding the current size of the organization. The Company Employee Count API provides the most recent reported headcount, linked directly to the filing source.
When you query a ticker like Apple (AAPL), you receive a specific, validated number rather than an estimate.
- Exact Headcount: The response provides the precise integer, such as 166,000 for the fiscal year ending in 2025. This allows for accurate "revenue per employee" calculations.
- Source Verification: The data includes a direct link to the SEC filing (e.g., 10-K filed on 2025-10-31), allowing you to audit the primary source if needed.
Tracking Historical Growth and Contraction
Context is everything. Knowing a company has 166,000 employees is useful, but knowing it grew from 21,600 employees in 2007 tells the story of its expansion. The Historical Employee Count API allows you to reconstruct this timeline instantly.
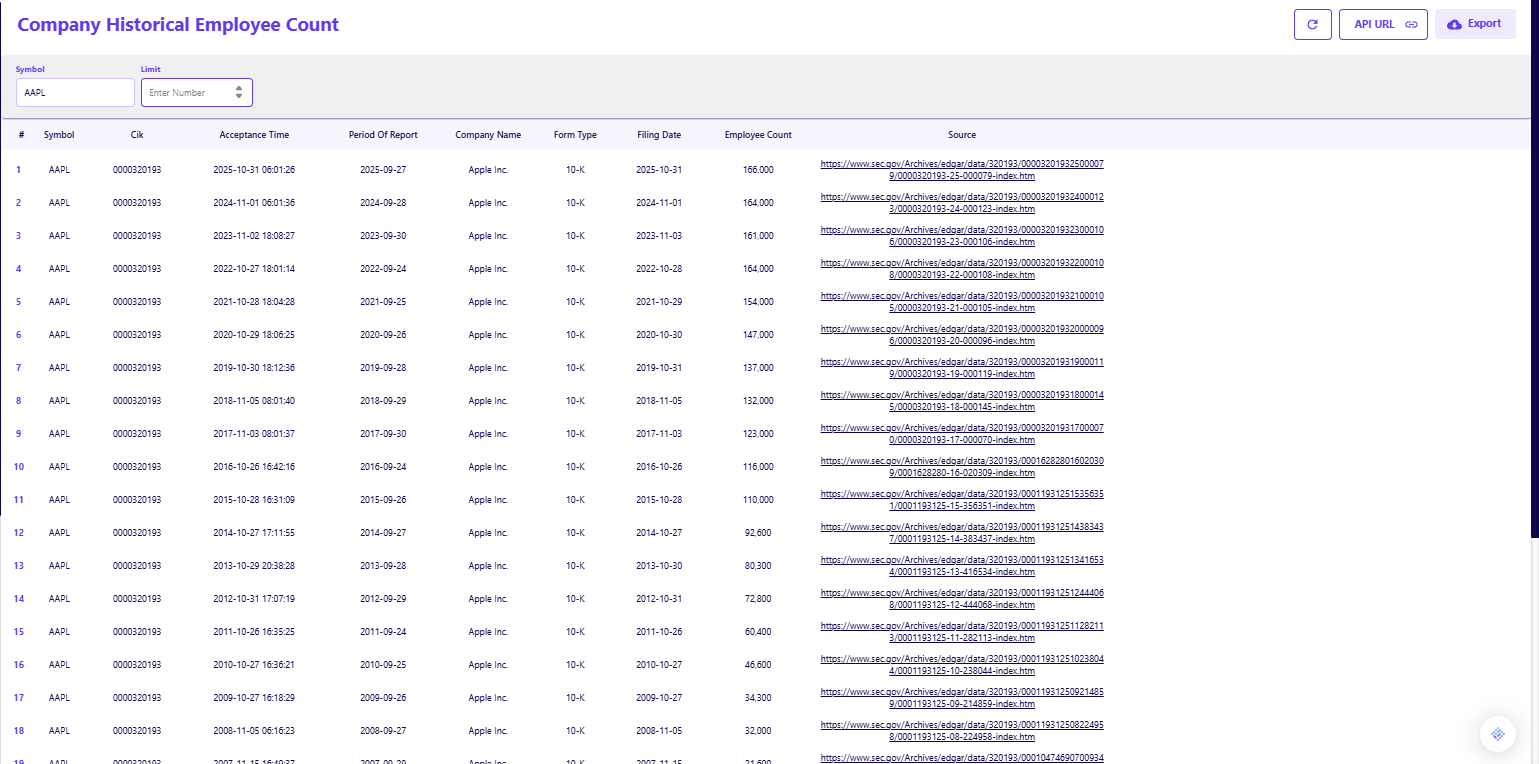
- Long-Term Trends: The endpoint returns a chronological list, showing the steady ramp-up or sudden drop-off in workforce size. For Apple, you can visualize the growth from 46,600 in 2010 to 164,000 in 2024.
- Period Consistency: The data includes the Period Of Report (e.g., 2025-09-27), ensuring that you are aligning the headcount with the correct fiscal year financial results.
Integrating Headcount into Due Diligence
Workforce data is rarely analyzed in isolation. It is most powerful when combined with other fundamental metrics to assess efficiency.
- Efficiency Ratios: By automating the retrieval of employee counts, you can dynamically update ratios like Revenue per Employee or Net Income per Employee every time a new 10-K is filed.
- Peer Benchmarking: You can loop this request across a specific sector to see which competitors are expanding their workforce and which are contracting.
For a broader view of how to standardize the descriptive data around these companies, reviewing how to pull clean company profiles using a free API is a valuable next step.
Automating the Operational Check
Tracking headcount changes with a free API turns a qualitative "feeling" about growth into a quantitative metric. It allows you to monitor the human capital investment of a company without relying on press releases or outdated "About Us" pages.
By integrating this endpoint, you ensure that your efficiency metrics are based on filed, accurate data. This simple addition provides a clearer picture of operational leverage and organizational momentum.
Frequently Asked Questions
How do I sign up for the free API?
To sign up, visit the documentation page, scroll down to the sign-up box, and insert your email address. No credit card is required.
Is the free plan really free forever?
Yes, the free plan is designed for personal use and allows for 250 requests per day. This gives you ample room to explore endpoints without an expiration date.
Do I need a credit card to get an API key?
No, the free tier is accessible without any payment information. You only need to provide a credit card if you decide to upgrade to a premium plan for higher rate limits or additional datasets.
Is employee count data available on the free plan?
Yes, the free tier typically allows access to both current and historical employee count endpoints, enabling you to track workforce trends without a paid subscription.
How often is this data updated?
Employee counts are generally updated annually or quarterly, depending on when the company files its 10-K or 10-Q reports with the SEC.
Does the API provide a breakdown by department?
No, the API provides the total full-time employee count as reported in regulatory filings. Companies rarely disclose detailed departmental breakdowns in these standardized reports.
Can I see the source of the data?
Yes, the API response includes a Source field containing a URL to the specific SEC filing where the number was reported.
How far back does the history go?
The historical data can span several decades, as seen in the Apple example which provides data going back to at least 2007.
Does this cover international companies?
Coverage depends on the filing standards. Companies that file with the SEC (including foreign issuers filing 20-Fs) are generally covered, while those listed only on local exchanges may vary.
Can I use this to calculate Revenue per Employee?
Yes, this is a primary use case. You would pull the Employee Count from this API and the Revenue from the Income Statement API to calculate the ratio.

Risk analysis and financial modeling for data-driven market workflows
Parth Sanghvi is a Senior Risk Consultant with experience in financial modeling, valuation, and risk analysis. For FMP, he focuses on translating complex market data and risk models into clear, accessible analysis for developers and investors. His work centers on helping readers understand how institutional-grade financial data applies to real-world workflows and decision-making.
Related




Financial data for every need
Real-time quotes and 30+ years of historical data, including prices, fundamentals, and insider transactions — all accessible via API.
Create Free Account