How to Track Stock Splits and Corporate Actions with a Free API

A stock split is purely a cosmetic change to the share count, yet it creates havoc for data pipelines. If your system interprets a 4-for-1 split as a standard price movement, your charts will show a 75 percent crash overnight, triggering false stop-losses and skewing historical volatility metrics.
For developers and analysts, the challenge is distinguishing between a genuine price collapse and a corporate action. Manually maintaining a list of upcoming splits is unreliable, as announcements can happen irregularly. Using a free Historical Stock Split API to programmatically track these events ensures that your historical data remains adjusted and your trading logic is not tricked by artificial price drops.
Getting Started: Obtaining Your Free API Key
Before you can pull corporate action data, you need to establish a connection. This requires an API key, which acts as your unique digital ID for making requests.
Getting set up is straightforward:
- Navigate to the Financial Modeling Prep pricing page.
- Locate the "Free" plan option and click "Get my free API key."
- Enter your email to start the registration process—no credit card is required.
- Once verified, your unique API key will be displayed on your dashboard.
This key allows you to make immediate calls to the API. For a more detailed walkthrough on setting up your environment, you can refer to this guide on how to sign up and use a free stock market data API.
Retrieving Historical Split Data
To adjust historical charts or calculate a correct cost basis for tax lots, you need the specific history of a ticker's structural changes. The Historical Stock Split API provides a chronological log of every split event for a specific company.
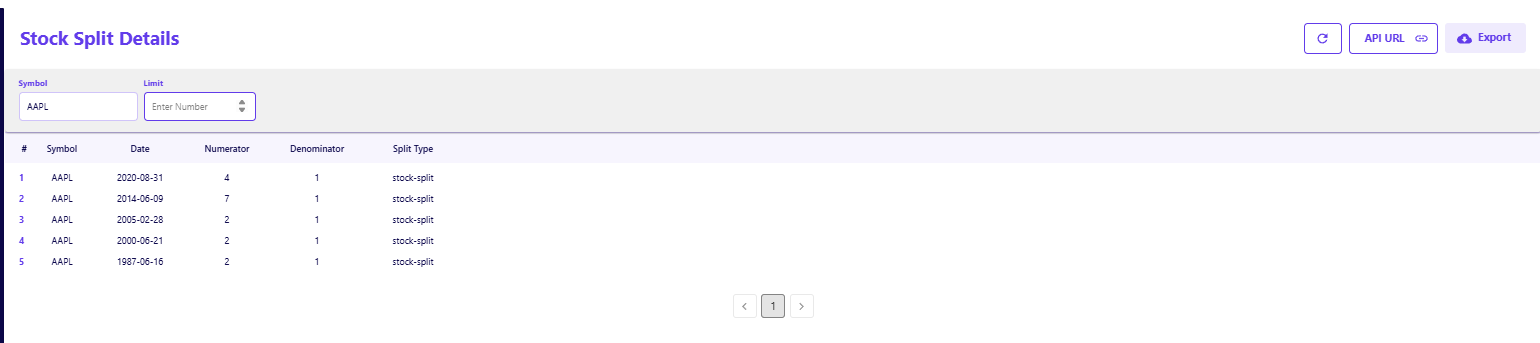
When you query a ticker like Apple (AAPL), the response details exactly how the share structure has evolved.
- Event Log: The output lists every event with its specific date. For Apple, you can see the 4-for-1 split on August 31, 2020, and the 7-for-1 split on June 9, 2014.
- Split Ratio: The API explicitly defines the Numerator and Denominator. For the 2020 split, the numerator is 4 and the denominator is 1, indicating you received 4 shares for every 1 held. This structured data allows you to automate the mathematical adjustment of your historical price arrays.
Monitoring the Market for Upcoming Splits
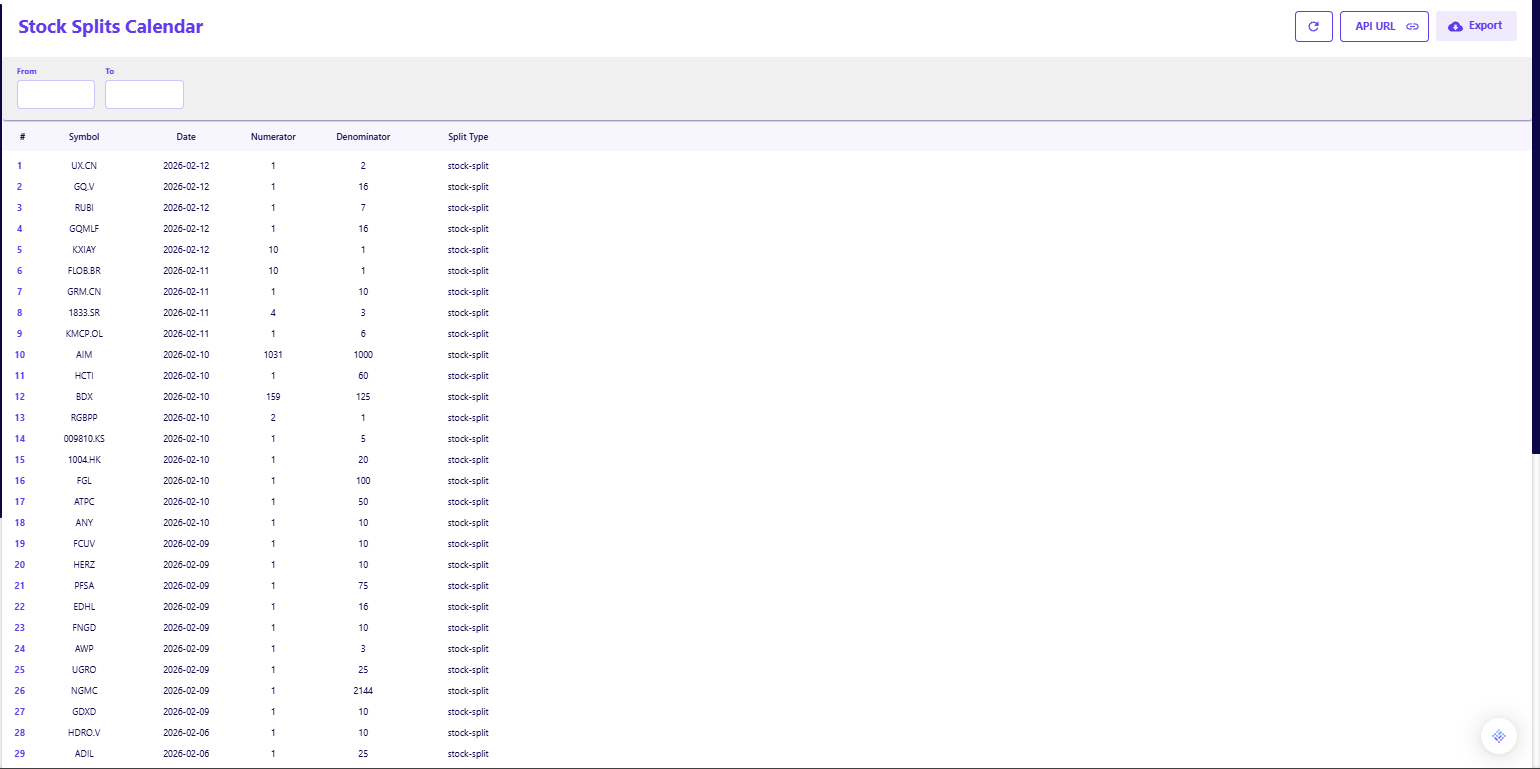
While the historical endpoint handles the past, you also need to know what is happening today or tomorrow. The Stock Split Calendar API scans the entire market to return a list of active and upcoming corporate actions.
- Market-Wide Scan: This endpoint returns a batch list of all companies undergoing splits within a specified window. In the sample output, you can see a diverse list of tickers (e.g., UX.CN, GQ.V) executing splits on the same day.
- Type Verification: The Split Type field (e.g., stock-split) confirms the nature of the event, helping you filter out reverse splits if your strategy treats them differently.
Integrating Split Tracking into Your Workflow
Handling stock splits is often a two-step process in a data workflow.
- Daily Maintenance: A script should run the Calendar API every morning to identify tickers that will split that day. This allows you to pause trading on those assets or trigger a recalculation of open orders.
- Historical Scrubbing: When a split is detected, you use the Historical API to calculate the adjustment factor. You then apply this factor to your database to smooth out the price discontinuity.
This maintenance routine is similar to how to track stock symbol changes, where the goal is to keep your reference data aligned with market reality.
Automating Data Continuity
Tracking stock splits with a free API is a defensive measure. It prevents your models from reacting to false signals and ensures your historical performance metrics are accurate. By automating this check, you remove one of the most common sources of data corruption in financial analysis.
Once you have secured your pricing history, you can focus on qualitative metrics, such as learning how to pull clean company profiles using a free API to better understand the businesses behind the tickers.
Frequently Asked Questions
How do I sign up for the free API?
To sign up, visit the documentation page, scroll down to the sign-up box, and insert your email address. No credit card is required.
Is the free plan really free forever?
Yes, the free plan is designed for personal use and allows for 250 requests per day. This gives you ample room to explore endpoints without an expiration date.
Do I need a credit card to get an API key?
No, the free tier is accessible without any payment information. You only need to provide a credit card if you decide to upgrade to a premium plan for higher rate limits or additional datasets.
Is stock split data available on the free plan?
Yes, the free tier typically allows access to both the historical split search and the split calendar, enabling you to maintain your data without a paid subscription.
Does the API cover reverse splits?
Yes, the API covers both forward splits (e.g., 2-for-1) and reverse splits (e.g., 1-for-10). You can determine the type by looking at the numerator and denominator (a 1-for-10 reverse split would have a numerator of 1 and a denominator of 10).
How soon is the calendar updated?
The calendar is updated as soon as companies formally announce the split and the exchange confirms the ex-date.
Do I need to manually adjust prices if I use this data?
If you are using the "Raw" price endpoint, yes. However, FMP also offers "Adjusted Price" endpoints that automatically account for these splits, which is often easier for charting.
Does this cover international markets?
The coverage includes major global exchanges. The sample data shows listings from Canadian exchanges (e.g., .CN, .V), indicating broad support beyond just US equities.
Why is the split date important?
The "Date" provided is typically the ex-split date. You must adjust all price data prior to this date to make it comparable to the price data after this date.

Risk analysis and financial modeling for data-driven market workflows
Parth Sanghvi is a Senior Risk Consultant with experience in financial modeling, valuation, and risk analysis. For FMP, he focuses on translating complex market data and risk models into clear, accessible analysis for developers and investors. His work centers on helping readers understand how institutional-grade financial data applies to real-world workflows and decision-making.
Related




Financial data for every need
Real-time quotes and 30+ years of historical data, including prices, fundamentals, and insider transactions — all accessible via API.
Create Free Account