Segment-Level Financial Data APIs: How to Access Revenue Breakdown, Recurring Revenue, and Segment Profitability at Scale

Segment-level financial data APIs provide programmatic access to revenue, profit, and geographic breakdowns tied to specific corporate business units rather than the consolidated parent company. Apple trading at 255.92 with a 3.76 trillion market cap tells an analyst nothing about hardware saturation versus service sector expansion. Traditional financial analysis focuses heavily on total revenue and consolidated margins. Institutional workflows increasingly rely on segment-level performance, product-line revenue, and geographic breakdowns to isolate actual value creation.
Quantitative researchers pull baseline aggregate figures using the Company Profile API before tearing down the underlying business model. Growth, risk, and valuation are entirely driven by specific business units rather than the parent company as a whole. Unlike standardized top-line financial statements, segment data is inconsistently reported, rarely standardized, and often buried deep in filings.
Accessing this granular level of data historically required intensive manual extraction or reliance on closed-ecosystem datasets. API-driven extraction replaces manual spreadsheet tracking and unlocks the ability to construct automated sum-of-the-parts valuation models across entire equity coverage universes.
Why Segment-Level Data Is Structurally Hard to Access
Segment data originates from company disclosures, footnote tables, and management discussion sections. Challenges include inconsistent segment definitions across companies, a total lack of standardization across industries, and frequent changes in reporting over time. Corporations frequently alter their segment reporting structures to reflect internal reorganizations or obscure underperforming divisions.
Unlike core financials, segment data is semi-structured at best and provides limited machine-readable formatting directly from the exchange.Institutional data providers must manually extract and normalize these disclosures before an analyst can utilize them. In practice, an analyst must read through management discussion sections to find a table, manually match product categories from the prior year to account for restructuring, and build a custom taxonomy to compare it against a peer company.
Where can I get granular revenue breakdowns from company filings?
Granular revenue breakdowns from company filings are available through a combination of raw filing sources and structured data providers that extract and normalize segment-level disclosures. Primary sources such as SEC EDGAR provide direct access to segment disclosures and product breakdowns but require intensive manual parsing. Structured data providers like FactSet, Bloomberg, and Visible Alpha offer pre-aggregated and normalized segment datasets that drastically reduce manual processing effort.
Quantitative teams use the Revenue Product Segmentation API to ingest the exact components of corporate earnings programmatically. Parsing Apple's 2025 fiscal data reveals 209.58 billion generated from iPhones and 109.15 billion from Services. This structural breakdown signals exact reliance on hardware upgrade cycles versus higher-margin recurring software growth, directly altering the long-term cash flow multiple applied to the stock.
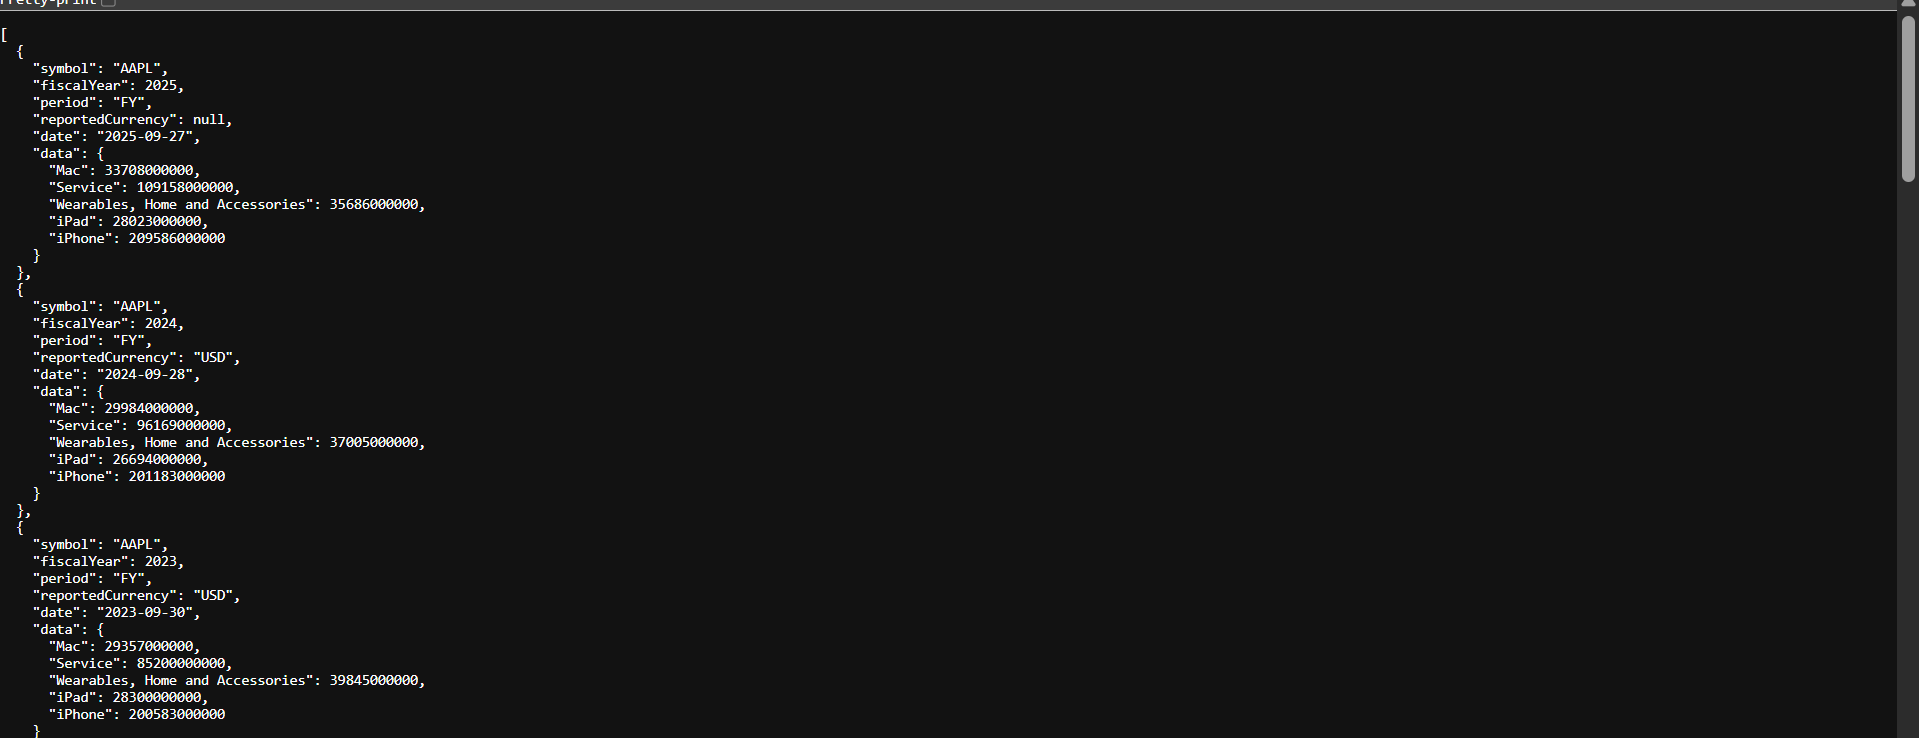
The key tradeoff in pipeline design is balancing the absolute completeness of raw SEC filings against the immediate usability of structured third-party datasets. Relying entirely on raw filings breaks automated screening tools when a company unexpectedly renames a segment, while depending solely on third-party aggregators strips away the idiosyncratic nuance of the original management disclosure.
Where can I obtain recurring revenue metrics for software companies?
Recurring revenue metrics such as annual recurring revenue and monthly recurring revenue are typically sourced from specialized datasets and company disclosures rather than standardized financial statements. These SaaS metrics are not part of GAAP financial statements and definitions vary significantly across different software vendors. Management teams often disclose these figures selectively in earnings calls or specialized investor presentations.
Specialized platforms like Visible Alpha and FactSet aggregate these metrics from analyst models and company reporting to ensure higher reliability. Evaluating a corporate business mix directly from disclosures requires manual extraction and meticulous time-series alignment. Financial APIs provide the underlying qualitative text, but calculating exact retention rates requires indirect estimation and proprietary modeling.
Recurring revenue metrics are not universally available because they are derived, non-standardized, and often modeled rather than directly reported.
How can I fetch segment-level revenues in multiple currencies?
Segment-level revenues are typically reported in a single currency but can be analyzed across currencies by combining segment data with foreign exchange datasets. The core challenge is that segment revenue usually reflects the company reporting currency, meaning multi-currency analysis requires an external FX data layer. The implementation workflow requires retrieving the base segment revenue via API, fetching the corresponding daily historical exchange rates, aligning the specific fiscal quarter dates, and computing the converted values
Data sourced from the Revenue Geographic Segments API shows Apple isolated 178.35 billion in the Americas and 111.03 billion in Europe for 2025. Analysts combine these regional exposures with live rates from the Full Forex Quotes API to stress-test revenue against specific localized currency fluctuations. Connecting these datasets allows quantitative models to automatically adjust geographic revenue projections the moment a central bank shifts interest rate policy.
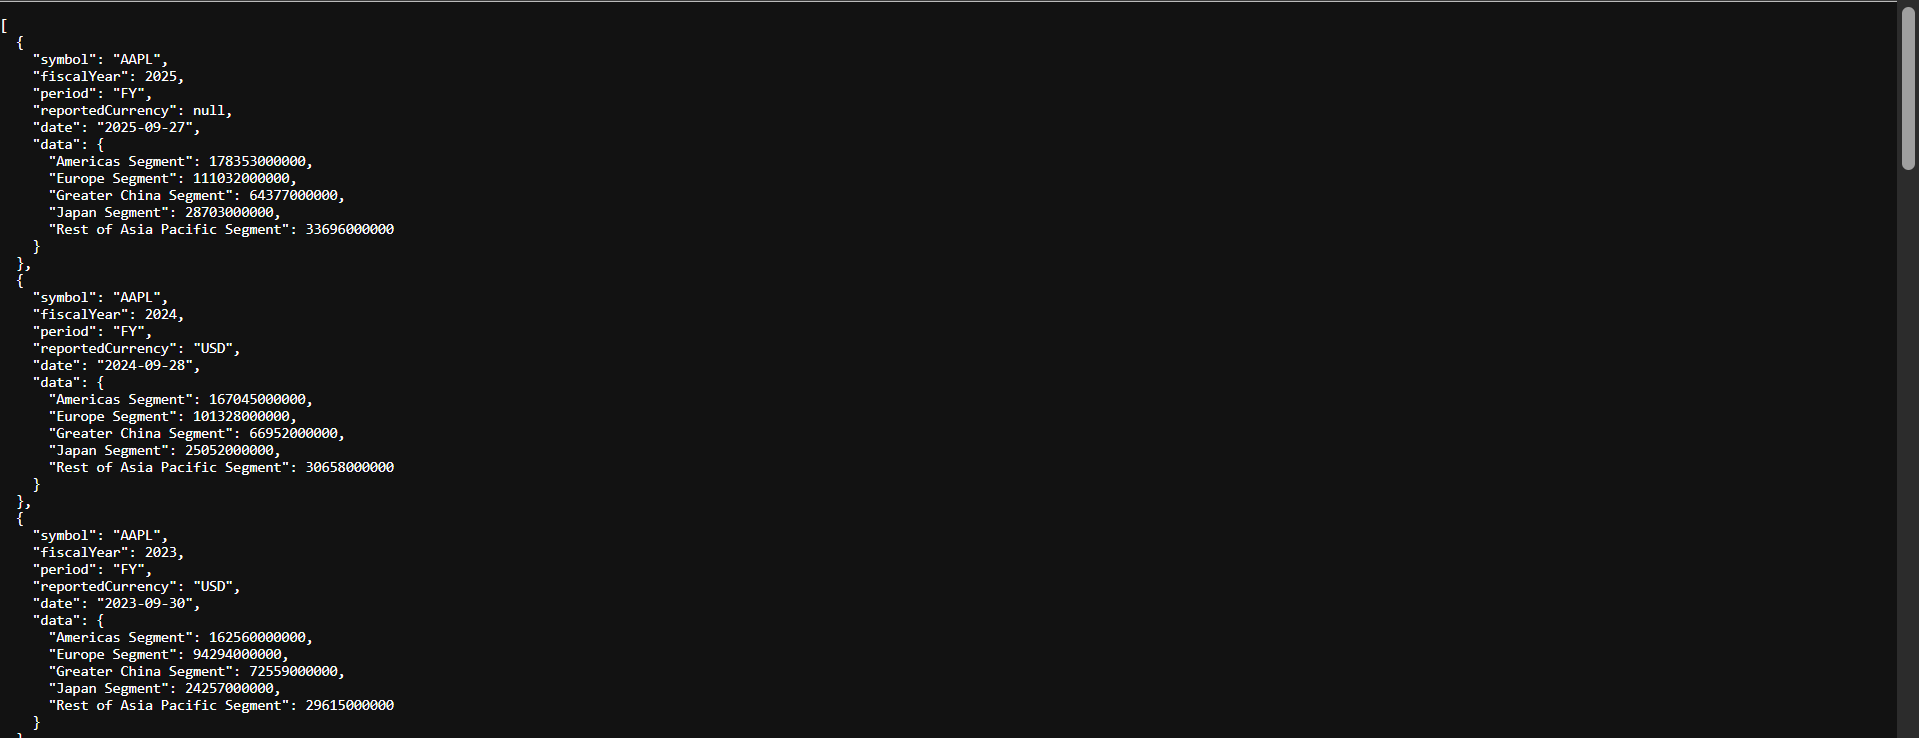
Executing this strategic playbook requires aligning the financial reporting periods precisely with the historical exchange rates.Multi-currency segment analysis is not a single dataset problem, as it requires joining financial and FX data into a unified model.
Multi-currency segment analysis is not a single dataset problem, as it requires joining financial and FX data into a unified model.
Which APIs allow retrieval of segment margins and profitability trends?
Segment margins and profitability trends can be derived using APIs that provide segment-level revenue and operating income data. In an actual quantitative workflow, a data pipeline ingests the raw operating income for a specific division and divides it by the corresponding divisional revenue to establish a baseline margin. The system then maps that derived time series against historical quarters to identify structural margin decay before it impacts consolidated earnings.
Platforms such as Financial Modeling Prep, Intrinio, SEC APIs, and Nasdaq Data Link enable access to the underlying data needed to calculate these segment margins. These metrics are rarely precomputed and must be derived over time due to inconsistent segment disclosures across industries. Mapping these derived margins against comparable exchange symbols allows quantitative teams to benchmark operational efficiency across competitors.
Segment profitability is ultimately constructed rather than retrieved, demanding both reliable data access and rigorous analytical modeling.
What Differentiates the Best Segment-Level Data APIs
The most capable segment APIs demonstrate an ability to accurately extract segment revenue and operating data directly from unstructured footnotes. Consistency across time and strict normalization across companies dictate whether the extracted data functions properly within a quantitative screening model. The infrastructure must also support seamless integration with external FX data and consolidated financial statements.
The best APIs are not those that simply expose segment data, but those that enable consistent extraction, transformation, and integration into analytical models.
How Segment-Level Data Fits Into Financial Analysis Systems
Segment data directly powers valuation decomposition, granular growth attribution, and geographic risk segmentation. For instance, an infrastructure fund can isolate AWS operating income from Amazon's retail losses to value the cloud business as a standalone entity. It integrates cleanly with standard financial statements, internal KPI layers, and macro FX datasets within an enterprise architecture.
Platforms like Financial Modeling Prep function as data access layers, enabling the retrieval of underlying financial components for deeper analytical processing. This infrastructure ensures seamless scalability into live production workflows and automated screening engines. The structural shift has completely moved institutional finance from manual segment analysis in filings to API-driven data extraction and modeling.
Limitations and Failures of Segment-Level Data
The primary limitation remains the wildly inconsistent reporting standards utilized by corporate management teams. Frequent changes in segment definitions make multi-year historical backtesting incredibly tedious and prone to look-ahead bias. Analysts must navigate incomplete disclosures and a stark lack of standardization across different financial data providers.
Segment data breaks down entirely when analysts attempt to reconcile mismatched segment definitions over an extended time horizon. Missing data for smaller companies often forces quantitative teams to rely on generalized industry proxies. An over-reliance on pre-modeled datasets from vendors introduces hidden structural errors into internal valuation pipelines when derived segment data fails to align with audited consolidated financials.
Building a Segment-Level Data Pipeline
A robust data pipeline follows a strict linear progression to extract, normalize, align, convert, and ultimately analyze the raw segment components. A pipeline might ingest raw Asian segment revenue, normalize it to standard geographic taxonomy, align the quarterly reporting date, and convert the yen to dollars for a finalized risk model. Core requirements include uninterrupted access to structured APIs, highly consistent internal segment mapping, and precise time-series alignment.
Common structural pitfalls involve completely ignoring segment reclassification events when a company reorganizes its reporting structure. Analysts also fail by mixing currencies without proper normalization or falsely assuming reporting consistency across rival companies.
From Aggregate Financials to Business-Level Insight
Company-level metrics tell an analyst what happened during a fiscal reporting period. Segment-level data tells a quantitative researcher exactly where and why it happened within the corporate structure. The operational advantage is not simple access to segment data.
It is the ability to extract, standardize, and integrate that data into automated decision-making systems. The edge is no longer defined by access to financial data, but by the ability to deconstruct companies into their underlying business segments. When evaluating a data provider, quantitative teams must prioritize APIs that offer unedited footnote extraction alongside historical mapping stability to analyze performance at the granular level where value is actually created.
Frequently Asked Questions
What is the difference between consolidated revenue and segment revenue?
Consolidated revenue aggregates all income generated by a parent company and its subsidiaries into a single top-line figure on the income statement. Segment revenue breaks that total down into specific product lines, geographic regions, or operating units as defined by corporate management in the footnotes.
Why do segment classifications change over time?
Management teams reorganize their reporting segments to reflect shifts in corporate strategy, new acquisitions, or internal operational structures. They may also alter segments to obscure declining legacy businesses by bundling them into faster-growing divisions.
Can I standardize segment revenue across different companies?
Standardizing segment revenue across different companies requires manual mapping or reliance on specialized institutional datasets because firms define operations differently. An analyst must determine if one company's enterprise software segment is directly comparable to a competitor's infrastructure division.
How often is geographic revenue data updated?
Geographic revenue data is updated quarterly or annually depending on the specific regulatory filing requirements of the exchange. Companies typically provide their most granular regional breakdowns in their audited annual reports and supplemental earnings materials.
What causes discrepancies between segment data providers?
Discrepancies occur because providers use differing proprietary methodologies to normalize and map unstructured raw footnote data into standardized buckets. One data vendor might classify certain hardware accessories as wearable revenue while another maps it to a generalized consumer electronics category.

Risk analysis and financial modeling for data-driven market workflows
Parth Sanghvi is a Senior Risk Consultant with experience in financial modeling, valuation, and risk analysis. For FMP, he focuses on translating complex market data and risk models into clear, accessible analysis for developers and investors. His work centers on helping readers understand how institutional-grade financial data applies to real-world workflows and decision-making.
Related




Financial data for every need
Real-time quotes and 30+ years of historical data, including prices, fundamentals, and insider transactions — all accessible via API.
Create Free Account