The Earnings Drift Effect: How Analysts Monitor Subtle Estimate Shifts to Predict Big Moves

Markets do not wait for the headline number. By the time earnings are reported, much of the real analytical work has already happened in the revisions leading up to the event. Forward estimates move quietly, often in increments that appear too small to matter on any single day. But across weeks or months, those small changes can accumulate into meaningful shifts in valuation, positioning, and price expectations.
This is the earnings drift effect in practice: not a single surprise, but a sequence of estimate adjustments that gradually changes the market's understanding of a company's trajectory. For analysts, finance teams, and portfolio managers, that sequence matters because it often carries more signal than a static snapshot of consensus at one point in time.
A stock with unchanged trailing metrics may already be undergoing a material re-rating if forward earnings estimates are creeping higher, price target ranges are tightening, or analyst dispersion is beginning to compress. Conversely, a company may still look stable on the surface while subtle downward revisions are steadily eroding the case underneath it. That is why estimate monitoring is not a periodic task. It is a daily workflow.
Static Metrics Miss What Is Changing
Most dashboards are built to answer a simple question: what does the company look like right now?
That is useful, but incomplete. Static metrics capture the current level of a forecast, the latest multiple, or the most recent guidance point. They rarely capture the direction, pace, and consistency of change. Yet in practice, those dimensions often matter more than the level itself.
A forward EPS estimate of 5 means very little without context. Was it 4.70 thirty days ago? Was it 5.20 last quarter? Did the estimate move because analysts updated revenue assumptions, margin expectations, or both? Did revisions come from a broad group or from only a few firms? A static number cannot answer those questions.
Drift analysis starts where the snapshot stops. It focuses on the path of expectations rather than the latest observation. That path is often where the earliest signal appears.
What Estimate Drift Really Captures
Estimate drift is best understood as the cumulative movement in forward expectations over time.
|
These are not cosmetic details. They reflect how the market's forward model is being rewritten.
Drift also captures the difference between event-driven interpretation and process-driven interpretation. A single earnings beat may dominate headlines for a day. A three-month pattern of upward revisions, rising target prices, and narrowing estimate dispersion often matters longer because it indicates that expectations themselves are being reset.
For that reason, experienced analysts do not treat revisions as isolated observations. They treat them as an evolving signal.
The Earnings Drift Signal Framework
Before going deeper into the mechanics, it helps to frame estimate drift through a few recurring signals analysts track over time. In practice, drift analysis is not based on a single revision but on a combination of changes that show whether expectations are strengthening, weakening, or becoming less certain beneath the surface.
Five key signals analysts track:
- Revision direction
- Revision breadth
- Guidance translation
- Estimate dispersion
- Price target drift
Why Small Revisions Can Lead to Large Price Implications
Markets reprice off expectations, not just reported results.
|
For example, a company's forward EPS estimate may rise from 3.20 to 3.55 over a six-week period while average price targets move from 180 to 210. None of those revisions appears dramatic on its own, but together they signal that analysts are reassessing both the company's earnings power and the valuation investors may be willing to support. |
When analysts revise estimates upward in small increments, the effect can appear minor in isolation. But the market does not process each change independently. It integrates them into a broader narrative about quality, durability, and confidence. Over time, that can influence both the earnings denominator and the multiple investors are willing to pay.
|
Consider a conceptual pattern. A company begins a quarter with stable revenue expectations and modest margin assumptions. Over the next six weeks, analysts raise revenue forecasts slightly, then increase EPS estimates more meaningfully, then begin lifting price targets. None of these changes looks dramatic on its own. Together, they signal that the forward earnings power of the business is being reassessed. |
That reassessment matters because price moves often follow the accumulation of evidence, not just the final confirmation. By the time a visibly strong quarter is reported, part of the move may already have happened through the drift in expectations.
The opposite pattern is just as important.
|
If consensus numbers slip gradually while target prices stop advancing and estimate dispersion widens, the market may already be losing conviction even before any obvious disappointment appears in reported results. |
In both cases, the signal lies in the sequence.
The Core Drift Signals Analysts Watch
Analysts typically monitor drift through several related dimensions. None should be viewed in isolation.
1. Revision Direction
The first question is straightforward: are forward estimates moving up or down?
This includes changes in revenue, EPS, EBITDA, free cash flow, or other forward metrics that matter for the business model. The direction of revision is the foundation of drift analysis because it shows whether the analytical community is becoming more constructive or more cautious.
What matters most is not just the latest revision, but its persistence. A consistent pattern of small upward changes often carries more weight than a one-time large adjustment.
2. Revision Breadth
Next comes breadth: how many analysts are participating in the move?
An upward revision from one analyst can be noise. A broad pattern of upward revisions across the coverage base suggests a more durable shift in expectations. Breadth helps distinguish idiosyncratic opinion changes from consensus formation.
This is especially important when consensus appears unchanged. A flat average can conceal a transition period in which some analysts have already moved while others have not yet updated.
3. Guidance Translation
Management guidance matters less for the headline itself than for how it translates into model changes.
When companies update guidance, analysts do not simply record the new range. They interpret what it implies for revenue cadence, margins, expense structure, and forward-year assumptions. The earnings drift effect often begins here, in the model translation layer between company commentary and published estimates.
A company may reiterate annual guidance while still prompting upward EPS revisions if analysts infer better operating leverage. Another may issue a superficially positive update that leads to lower estimates once the underlying assumptions are unpacked.
The signal is not the statement. It is the downstream revision path.
4. Dispersion and Convergence
Consensus averages can hide a great deal.
Two companies can share the same forward EPS estimate while carrying very different distributions of analyst expectations. High dispersion indicates disagreement about the underlying outlook. Falling dispersion often signals increasing confidence and a more stable narrative.
That matters because a consensus number with narrowing dispersion is generally more informative than one held together by offsetting extremes. Analysts watch whether forecasts are converging, fragmenting, or rotating around a new baseline.
Dispersion is not just a measure of uncertainty. It is a measure of how firmly the market's forward view is taking shape.
5. Price Target Drift
Estimate drift is stronger when it begins to show up in price targets.
Price target changes are not a pure signal, since they can reflect multiple expansion, broader market effects, or changes in required return assumptions. But in combination with estimate revisions, they are useful because they show whether analysts are translating improved operating expectations into explicit valuation changes.
If EPS estimates rise but price targets do not, the market may still be questioning durability. If both move together, the signal is stronger.
Why Drift Monitoring Belongs in the Daily Workflow
Estimate drift is not something analysts review only ahead of earnings season. It is part of ongoing surveillance.
The reason is simple: revisions do not arrive all at once. They appear in layers. A note after management commentary. A model update after channel checks. A target revision after an industry data point. A peer read-through that changes expectations across a group. Each update is incremental. The analytical edge comes from recognizing the pattern before it becomes obvious.
This is why drift monitoring tends to be operational rather than episodic. Teams review revision logs, compare estimate paths across peers, track which assumptions moved, and watch how quickly the sell side is incorporating new information. The goal is not to react to noise. It is to detect whether the baseline is shifting.
For finance teams, this is also useful internally. External estimate drift can reveal how the market is interpreting guidance, where expectations may be diverging from management's intended message, and when the consensus may be setting up too high or too low into a reporting event.
For portfolio managers, daily drift monitoring helps separate companies that are merely stable from companies whose forward profile is quietly improving or deteriorating.
Conceptual Drift Patterns That Matter
Several recurring patterns are especially useful in practice.
One is the slow upward staircase: small positive revisions across multiple periods, accompanied by tightening dispersion and gradual price target increases. This often reflects building confidence rather than excitement. It tends to be analytically durable because the signal is reinforced from several angles.
Another is the unstable plateau: consensus estimates remain nearly unchanged, but individual analyst forecasts spread wider and target revisions become mixed. On the surface, nothing has changed. Underneath, conviction is deteriorating. This often precedes larger resets.
A third is post-event acceleration. After an earnings release or guidance update, the first revision wave may be modest. The stronger signal appears when follow-up revisions continue in the same direction over subsequent days or weeks. That suggests the market is not just digesting a single event, but re-underwriting the forward story.
These patterns are valuable precisely because they are hard to detect through static screens.
Turning Drift Into a Repeatable Research Process
The challenge with revision analysis is rarely theory. It is structure.
Analysts usually know that estimate changes matter. The problem is that forward data is often monitored informally: notes in inboxes, ad hoc spreadsheet checks, or periodic reviews of consensus pages. That makes it difficult to build a repeatable process around what should be a persistent signal.
A robust workflow starts by separating raw forward data from the interpretation layer.
- First, collect the estimate history, target history, earnings event dates, and corresponding price history in a standardized format.
- Next, transform those feeds into comparable daily or weekly series.
- Then compute the features that matter: revision magnitude, revision breadth, dispersion change, target drift, and pre-event versus post-event behavior.
- Only after that should the analyst interpret the signal.
This matters for two reasons.
- First, repeatability. If drift is measured the same way each day across every covered name, the output becomes comparable. Teams can rank names, monitor changes systematically, and test whether certain drift patterns have historically preceded stronger outcomes.
- Second, defensibility. When the signal is generated from structured forward data rather than manual observation, it becomes easier to validate, explain, and refine. That is critical in institutional workflows, where a signal must be reproducible to be trusted.
In other words, drift becomes more valuable when it stops being anecdotal.
Building the Data Layer for Drift Analysis With FMP
A practical drift framework depends on clean, structured forward data. FMP's endpoints provide a direct way to assemble the core inputs needed for this workflow, including analyst estimates, price target summaries, earnings dates, and historical price series. Used together, these endpoints make it possible to move beyond a static consensus snapshot and measure whether expectations are drifting, accelerating, or losing conviction over time.
A typical monitoring stack can be organized around four building blocks:
Analyst estimates
For tracking the evolution of forward revenue, EPS, and related projections over time.
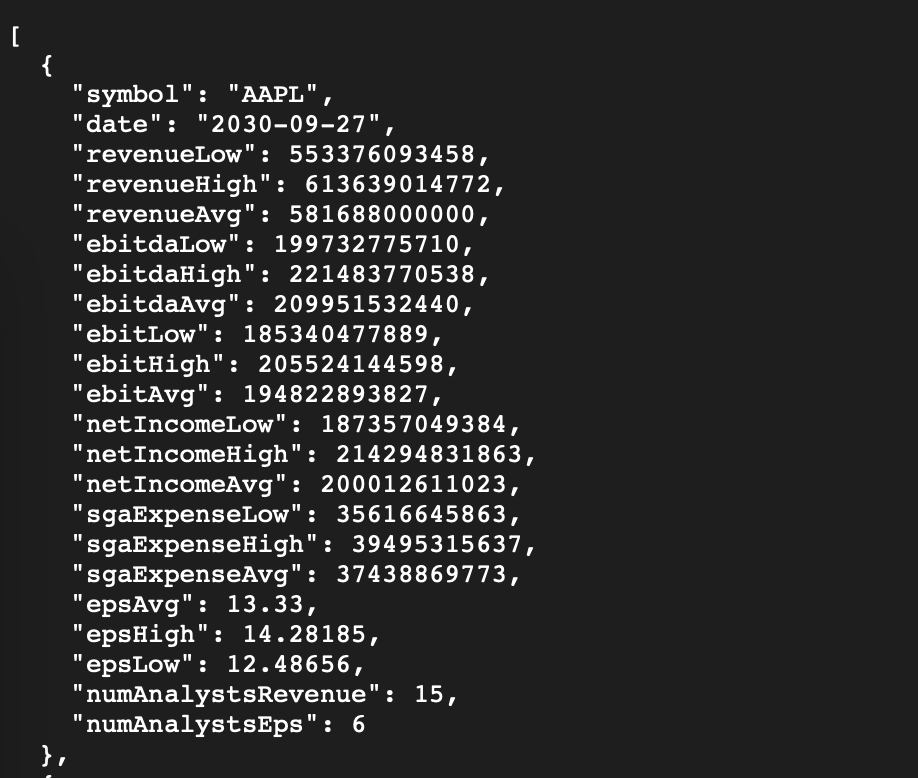
The Analyst Estimates endpoint is the starting point for drift analysis because it gives direct access to forward-looking analyst forecasts, including projected revenue, EPS, and other estimated financial metrics. In practice, this is the dataset analysts use to compare today's forward view with the version from reporting cycles. It is especially useful for measuring the direction and persistence of revisions, which is the core of the earnings drift effect.
FMP's Analyst Estimates API Endpoint
Price target summaries
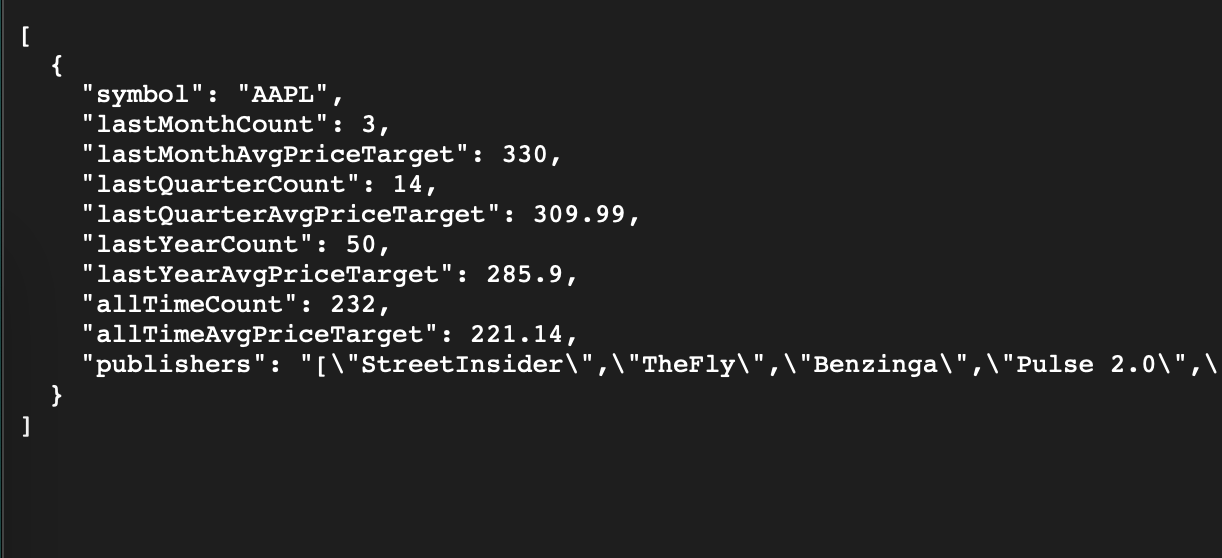
The Price Target Summary endpoint adds the valuation layer. While estimate revisions show how analysts are changing their operating expectations, price target data shows whether those changes are being translated into a more constructive or more cautious valuation view. For drift analysis, that makes it useful as a confirmation signal: if estimates rise and average targets also move higher, the message is typically stronger.
FMP's Price Target Summary API Endpoint
Earnings calendar data
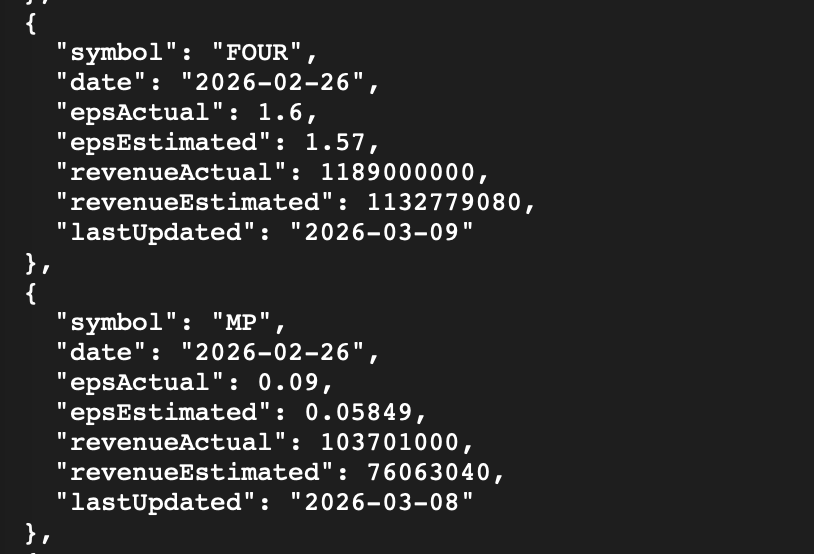
The Earnings Calendar endpoint provides the event framework around the revisions. Estimate drift becomes much more informative when it is aligned to earnings dates, because analysts often want to know whether revisions are clustering ahead of a report, continuing after one, or fading as the event approaches. That makes it useful for segmenting drift into pre-event and post-event windows rather than treating all revisions as equal.
FMP's Earnings Calendar Data API Endpoint
Historical price data
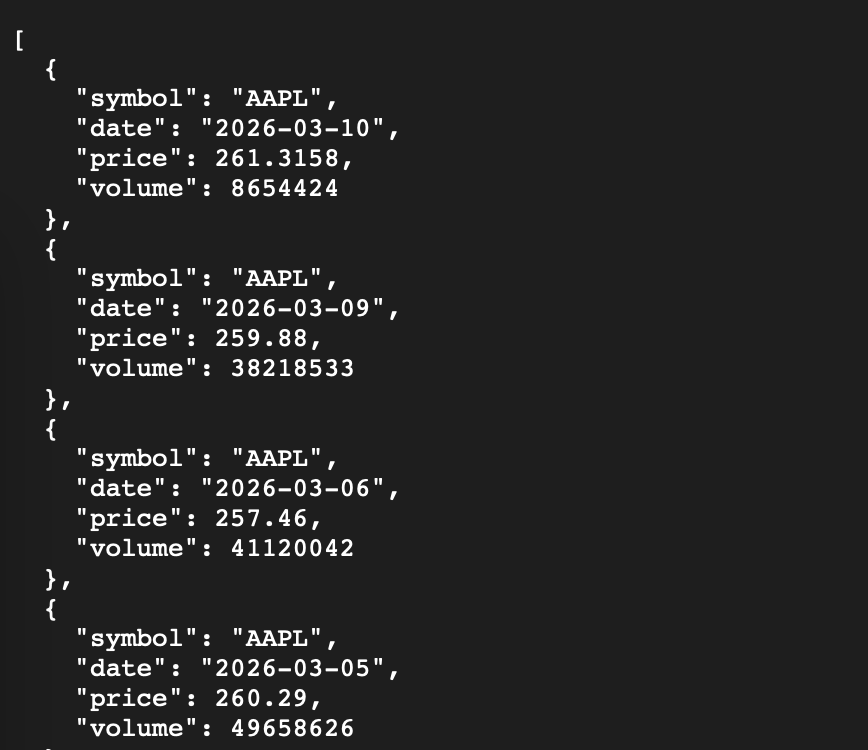
The Historical Price endpoints connect revisions to market behavior. FMP's light version is useful when a workflow only needs date-level price history for event studies or simple return calculations, while the full version adds a more detailed end-of-day record with open, high, low, close, volume, price changes, percentage changes, and VWAP. That makes the price endpoints the bridge between expectation change and realized market response. For drift work, they are typically used to test whether names with persistent upward revisions outperform after the revision window, or whether widening uncertainty is followed by weaker or more volatile price action.
FMP's Historical Price Data API Endpoint
Used together, these datasets let analysts move from observation to framework. Instead of simply noticing that expectations are changing, they can measure how quickly they are changing, whether those changes are broad or narrow, how they align with earnings events, and what price behavior has historically followed similar setups.
From Signal Detection to Better Forecasting
The deeper value of drift analysis is not that it predicts every move. No single indicator does.
Its value is that it captures expectation change early, before it is fully visible in reported results or static screens. It helps analysts identify when the forward model is strengthening, when uncertainty is rising beneath a stable consensus, and when the market may be underreacting to a steady sequence of revisions.
|
In a market defined by forward expectations, drift is rarely noise. More often, it is the earliest version of the move.
The firms that monitor it systematically are not just reacting faster. They are identifying expectation shifts early, while the revision signal is still subtle and before the full market response is priced in.
FAQ
What is the earnings drift effect?
The earnings drift effect refers to the gradual change in market expectations caused by a sequence of small analyst estimate revisions over time. Instead of one major surprise driving the story, the signal comes from the steady accumulation of changes in forward revenue, EPS, margins, or price targets that quietly reshape how investors value a company.
Why is estimate drift more useful than a static consensus snapshot?
A static consensus figure only shows where expectations stand at one moment. Drift analysis shows how those expectations got there. That difference matters because the direction, pace, and consistency of revisions often provide earlier insight into changing sentiment, operating outlook, and valuation than a single point-in-time estimate.
What signals do analysts usually track when monitoring estimate drift?
Analysts typically focus on revision direction, revision breadth, guidance translation, estimate dispersion, and price target drift. Together, these help determine whether the market's forward view is becoming more constructive, more cautious, or simply more uncertain beneath an unchanged average consensus number.
Can small estimate revisions really lead to meaningful stock moves?
Yes. Small revisions may appear insignificant on their own, but markets often respond to the cumulative effect of repeated changes. When revenue estimates, EPS forecasts, and price targets all move in the same direction over time, they can alter both earnings expectations and the valuation multiple investors are willing to pay.
How does estimate drift help ahead of earnings season?
Drift monitoring helps analysts identify whether expectations are strengthening or weakening before the earnings release. It can reveal whether a company is quietly being re-rated, whether conviction is building, or whether risk is increasing even before the headline results are reported. This makes it valuable for pre-event positioning and post-event interpretation.
What data is needed to build a repeatable drift analysis process?
A strong drift framework typically requires analyst estimate history, price target history, earnings event dates, and historical price data. When these inputs are standardized and tracked consistently, teams can measure revision magnitude, breadth, dispersion changes, and post-revision price behavior in a way that is systematic, comparable, and testable.

Treasury, trading, liquidity, and equity analysis for investors
Sanzhi writes for FMP with a focus on equity analysis, valuation, market data, and practical investment decision-making. He has worked across financial institutions in treasury, trading, and liquidity roles, bringing hands-on experience in investment analysis, market execution, risk, and strategy. His work focuses on helping readers interpret financial data with clarity, discipline, and an institutional market perspective.
Related




Financial data for every need
Real-time quotes and 30+ years of historical data, including prices, fundamentals, and insider transactions — all accessible via API.
Create Free Account