Connect Cross-Asset Market Signals Through Integrated Risk Monitoring

Market risk rarely appears in one place. An equity index may weaken while the dollar strengthens, oil moves sharply, crypto loses momentum, and macro news adds another layer of uncertainty. Each signal matters on its own, but the bigger risk often appears when these movements start pointing in the same direction.
That is why cross-asset monitoring needs more than separate dashboards. Analysts may track equities, forex, commodities, crypto, sector performance, volatility, and market news every day, but the difficult part is connecting them consistently. A sector decline may look isolated until it aligns with commodity pressure and currency movement. A dollar rally may look like a forex event until it starts affecting commodities, multinational earnings exposure, and risk appetite across global markets.
For Claude MCP setups, this also creates a data quality challenge. The model can reason across markets only when the underlying datasets stay structured, aligned, and comparable. Financial Modeling Prep gives analysts that aligned data layer across equities, sectors, forex, commodities, crypto, news, and related indicators, which is what makes cross-market reasoning possible in the first place.
This article shows how to use FMP data through Claude MCP to create a cross-asset risk review. The review connects signals across asset classes and classifies the setup as risk-on, risk-off, commodity-driven, dollar-driven, sector-led, or escalation watch, with severity and confidence attached to each condition. The goal is not another market summary. It is a repeatable view that helps analysts decide when disconnected market signals deserve escalation.
Why Cross-Asset Risk Monitoring Breaks Down
Cross-asset analysis becomes difficult because each market explains only one part of the picture. Equity indices show whether investors are reducing or adding exposure, but they do not always explain the source of the move. Sector performance shows where stress appears, but it may not reveal whether the pressure comes from rates, commodities, currency movement, earnings risk, or macro news.
The same issue appears across other asset classes. Forex data can show dollar strength, but analysts still need to understand whether that strength reflects policy expectations, global risk aversion, or weakness in other currencies. Commodity prices can point to inflation pressure, supply disruption, or slower demand. Crypto can signal changing liquidity conditions or risk appetite, but it can also move because of asset-specific events.
This creates a consistency problem for research and risk teams. Two analysts may review the same market day and reach different conclusions if they weigh each signal differently. One may treat an oil spike as an energy-sector event. Another may connect it to inflation expectations, transport margins, consumer spending pressure, and central bank sensitivity. Without a common escalation framework, cross-market interpretation becomes dependent on individual judgment.
The data side adds to the problem. If equities, sectors, commodities, forex, crypto, volatility signals, and macro news come from disconnected sources, the analyst spends too much effort reconciling formats, timing, symbols, and context before the interpretation can even begin. Claude MCP can help interpret relationships, but it needs clean and aligned inputs before the cross-market reasoning becomes reliable. A consistent FMP data layer reduces that friction and supports a more comparable read across markets.
The bigger breakdown happens when teams monitor each market separately and connect the signals too late. A sector selloff may not look serious in isolation. A stronger dollar may not look urgent on its own. A commodity move may look temporary. When these signals appear together, though, they can point to a larger transition. Cross-asset interpretation should identify that connection early, classify how severe it looks, and explain why it matters, without claiming to resolve the uncertainty that comes with market movement.
The Data Foundation Behind Cross-Asset Interpretation
Cross-asset reasoning depends on inputs that can speak to each other. If equities, sectors, forex, commodities, crypto, rates, and macro context come from disconnected sources, Claude has to reconcile formats before it can compare market behavior. FMP gives Claude MCP a structured multi-asset data foundation that turns those inputs into an evidence map, with each dataset playing a specific role in the cross-market read.
Equity and index reaction sits at the center of any cross-asset review. The Stock Price and Volume Data API, Stock Quote API, and Historical Index Full Chart API together provide the price action, volume context, and benchmark movement that show how the broader market and individual issuers are responding.
Sector and industry spread is what separates a localized move from a wider transition. The Historical Market Sector Performance API and Historical Industry Performance API track sector-level and industry-level performance, which is how Claude tests whether pressure is contained or starting to spread into economically sensitive areas.
Currency pressure matters because the dollar often sits behind multi-asset moves. The Historical Forex Full Chart API supplies the OHLC and percentage change data for currency pairs that show whether forex movement is supporting or contradicting the equity and commodity picture.
Commodity pressure adds the inflation, demand, and supply lens. The Full Chart API for Commodities and Commodities List API cover historical price action and the tradable commodity universe across energy, metals, and agricultural markets, which is how oil, gold, and industrial metal movement get folded into the read.
Crypto and risk-appetite signals help indicate liquidity and speculative behavior, though they need to be treated as confirming rather than standalone signals. The Historical Cryptocurrency Full Chart API and Real-Time Cryptocurrency Batch Quotes API supply the price and quote data behind that read.
Macro and rates context anchors the interpretation. The Economic Indicators API supplies releases such as GDP, inflation, and unemployment. The Economic Data Releases Calendar API flags upcoming releases, which helps separate scheduled macro risk from unexpected market stress. The Treasury Rates API provides current and historical yields across maturities, which matter for rate-sensitive sectors like utilities, real estate, and financials.
News context explains what is driving the price action. The Stock News API ties movement to company and sector developments, while the General News API picks up broader macro and policy news that helps frame the market reaction.
Direct volatility data is not retrieved as a dedicated FMP input in this review. The workflow can use volatility proxies where available, drawing on equity price action, sector dispersion, and rate movement to approximate cross-market volatility behavior.
Comparable inputs, consistent timing, and shared context are what make the cross-market read possible. Equity reaction shows the market response, sector and industry data show where the pressure sits, forex, commodities, crypto, and Treasury rates point to the likely driver, and news and macro releases add timing. The evidence map is what lets Claude compare price action, macro context, and sector pressure within one structured review.
Accessing FMP Data via Claude MCP
To run this system inside Claude, we connect Financial Modeling Prep's data layer through its MCP server, which allows Claude to retrieve financial datasets directly without writing manual API requests.
You first need an active FMP API key, which can be generated from your Financial Modeling Prep dashboard. This key is used to authenticate all MCP-based data requests.
Once the API key is available, FMP can be connected in Claude using its remote MCP endpoint:
|
https://financialmodelingprep.com/mcp?apikey=YOUR_FMP_API_KEY |
In Claude, navigate to Settings → Connectors → Add custom connector, and paste this URL into the Remote MCP Server field. After saving, Claude will automatically discover the available FMP tools.
For this article, the MCP-based surveillance system avoids separate market summaries. It focuses on connected stress conditions across equities, sector performance, forex, commodities, crypto, macro news, economic indicators, and Treasury rates. That distinction matters because cross-asset risk rarely appears as a single clean signal.
The cross-asset review avoids producing separate market summaries. It focuses on connected stress conditions across the equity, sector, forex, commodity, crypto, rates, and macro datasets covered earlier. That distinction matters because cross-asset risk rarely appears as a single clean signal.
A typical analysis can start with equity and index movement to understand market direction. Claude can then check sector and industry performance to locate where the pressure sits. From there, it can compare forex, commodities, crypto, Treasury rates, and macro news to identify the likely driver behind the move. The interpretation is stronger when the inputs follow a consistent structure, which is what the FMP data layer is doing in the background.
The output classifies the market setup, identifies likely drivers, assigns severity and confidence, and flags whether the signal needs analyst review.
Cross-Asset Escalation Framework
A cross-asset review needs clear escalation logic. Market signals can move in different directions during normal rotation, but risk becomes more important when several asset classes confirm the same pressure point. The point is to separate noise from connected stress, while recognizing that most market moves have several plausible drivers rather than a single clean cause.
Risk-On and Risk-Off Transitions
The first read identifies whether investors are adding or reducing exposure, based on the available signals in this review. Equities, Treasury rates, commodities, and forex movement together help Claude classify the market posture. A broad equity decline with a stronger dollar and weaker commodities can indicate risk-off pressure. A recovery in equities with stable rates and firmer cyclical commodities can point to risk-on behavior. Crypto can be folded in as a confirming signal for liquidity and speculative appetite, but it is not treated as a primary indicator of market-wide risk because crypto can move for asset-specific reasons.
Commodity-Driven Stress
The second read tracks commodity movement, which can affect inflation expectations, corporate margins, sector performance, and consumer demand. A sharp oil move can pressure airlines, transportation, consumer discretionary, and energy-sensitive industries. A rise in gold can reflect defensive positioning. Weakness in industrial metals can point toward slower growth expectations. Each of these reads is conditional. Commodity moves can reflect supply, demand, inflation, or currency context, so the interpretation depends on what the other asset classes are doing at the same time.
Dollar-Driven Market Shifts
The third read focuses on the dollar. A stronger dollar can pressure commodities, multinational earnings, and emerging-market exposure, and it can signal tighter global liquidity when it appears alongside weaker equities and rising stress in risk assets. A weaker dollar can support commodities and risk assets, but the read depends on the broader setup. A stronger dollar in isolation is not automatically negative. It becomes a more meaningful signal when equities, commodities, or rates confirm the same direction.
Sector Contagion
The fourth read separates isolated sector weakness from broader spread. A single weak sector may reflect company-specific or industry-specific pressure. Wider weakness across financials, industrials, technology, and consumer discretionary can indicate a broader macro condition. This is where the output's affected sector view becomes most useful, because it flags whether stress is contained in one corner of the market or spreading into the economically sensitive sectors that move with the cycle.
Cross-Market Confirmation
The fifth read looks for simultaneous pressure across equities, crypto, commodities, rates, and forex. Stress in one asset class may not require escalation. But when several asset classes show the same pressure at the same time, the signal carries more weight. This is treated as cross-market confirmation rather than a pure volatility read, because direct volatility data is not retrieved as a dedicated FMP input in this review. Confirmation across markets is the strongest evidence that a setup is moving from normal rotation toward a more connected stress condition.
Each signal receives a severity and confidence level. Severity explains how serious the condition looks. Confidence explains how strongly the available FMP data supports the interpretation. A high-severity signal with low confidence may need further review, while a medium-severity signal with high confidence may deserve immediate escalation if several asset classes or sectors are involved.
This structure turns cross-market analysis into a repeatable risk review. Claude uses FMP data to connect price action, sector movement, macro context, and likely drivers into one interpretation, giving analysts a clearer view of what changed, where the pressure sits, and whether the signal deserves escalation.
Running the Claude MCP Prompt
Once the FMP MCP connector is active, the next step is to ask Claude to pull the required market inputs and convert them into a compact cross-asset review. The prompt has to avoid a broad market recap and push Claude toward connected signals, escalation logic, severity, confidence, and affected sectors.
Use the prompt below inside Claude:
|
Use Financial Modeling Prep data through the MCP connector to create a compact cross-asset risk review. Time window: - Use the latest available trading day for current price action. - Use the last five trading days to identify directional pressure and confirmation across asset classes. - Use the most recent available macro releases and economic calendar entries. Analyze current signals across: - equities - sector performance - forex - commodities - crypto - macro news - economic indicators - Treasury rates - volatility-related signals or proxies where available Focus only on connected risk signals. Do not write a general market summary. Detect the following conditions: 1. risk-on or risk-off transition 2. commodity-driven stress 3. dollar-driven market shift 4. sector contagion 5. cross-market confirmation 6. cross-market escalation condition Return the output in this exact structure: 1. Cross-Asset Escalation Matrix Create a compact table with these columns: - Signal - Asset Classes Involved - Affected Sectors - Likely Driver - Severity: Low / Medium / High - Confidence: Low / Medium / High - Escalation Required: Yes / No - Supporting FMP Evidence Keep each row short. Use only evidence found from FMP data. 2. Risk State Classification Return only one classification: - Risk-On - Risk-Off - Mixed - Defensive Rotation - Escalation Watch Add 3 short bullets explaining why. 3. Top 3 Drivers List the top 3 drivers behind the current cross-market setup. Each driver must include: - driver name - linked asset classes - likely market effect - confidence level 4. Affected Sector View List the sectors most exposed to the detected signals. Use this format: - Sector: - Reason: - Severity: 5. Final Monitoring Note Write a short 4-5 line monitoring note for an institutional risk team. Important constraints: - Separate observed FMP data from interpretation. State the data first, then the analytical read. - When signals conflict or supporting evidence is thin, state that confidence is low and explain why. - Use "likely driver" rather than asserting a single cause. - Do not write a long explanation. - Do not provide a broad market recap. - Do not include investment advice. - Do not use promotional language. - Keep the output structured and compact. |
The output gives the review a structured starting point. Claude does not only list market moves. It groups them into escalation conditions, links them with supporting FMP evidence, and separates broad market noise from signals that deserve closer review.
For the run referenced in this article, Claude classified the market setup as Escalation Watch and pointed to pressure across macro data, institutional positioning, equity breadth, UK fiscal stress, and the Treasury curve. The next section turns that output into an analyst-style read and explains why these connected signals matter for cross-asset interpretation.
Interpreting the Claude Output
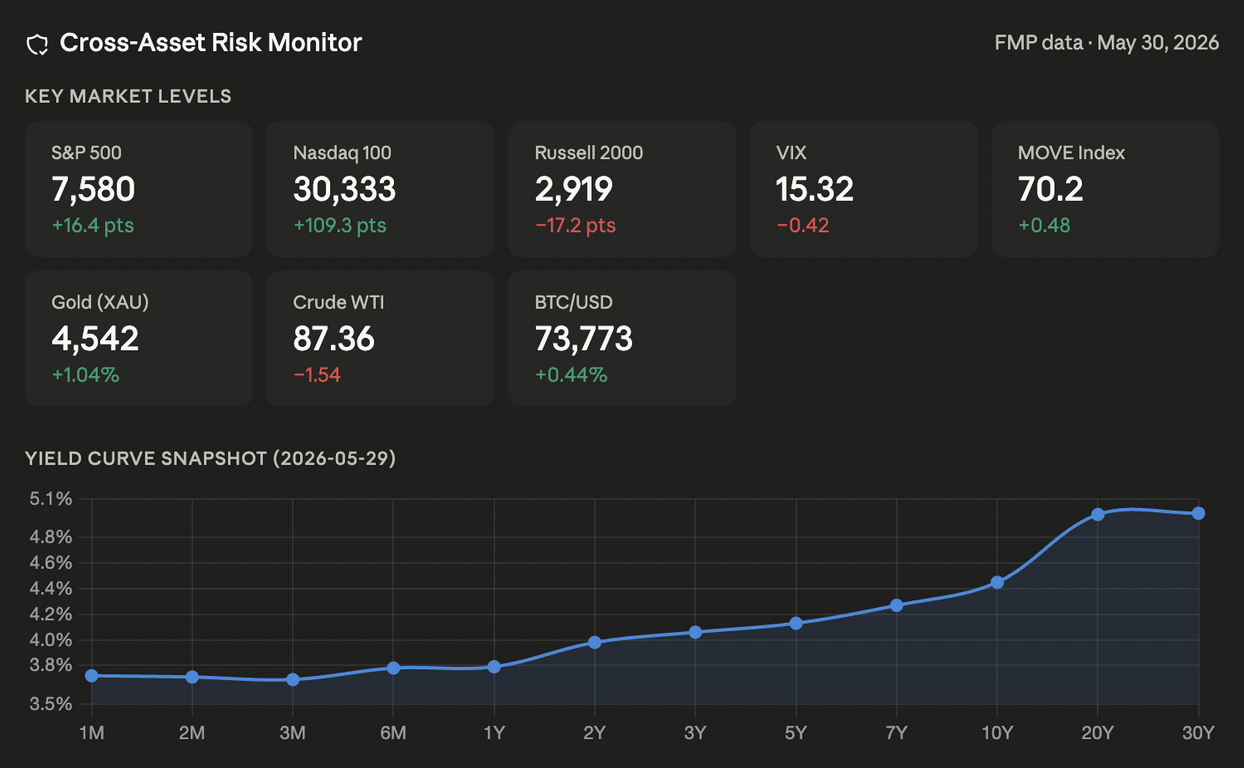
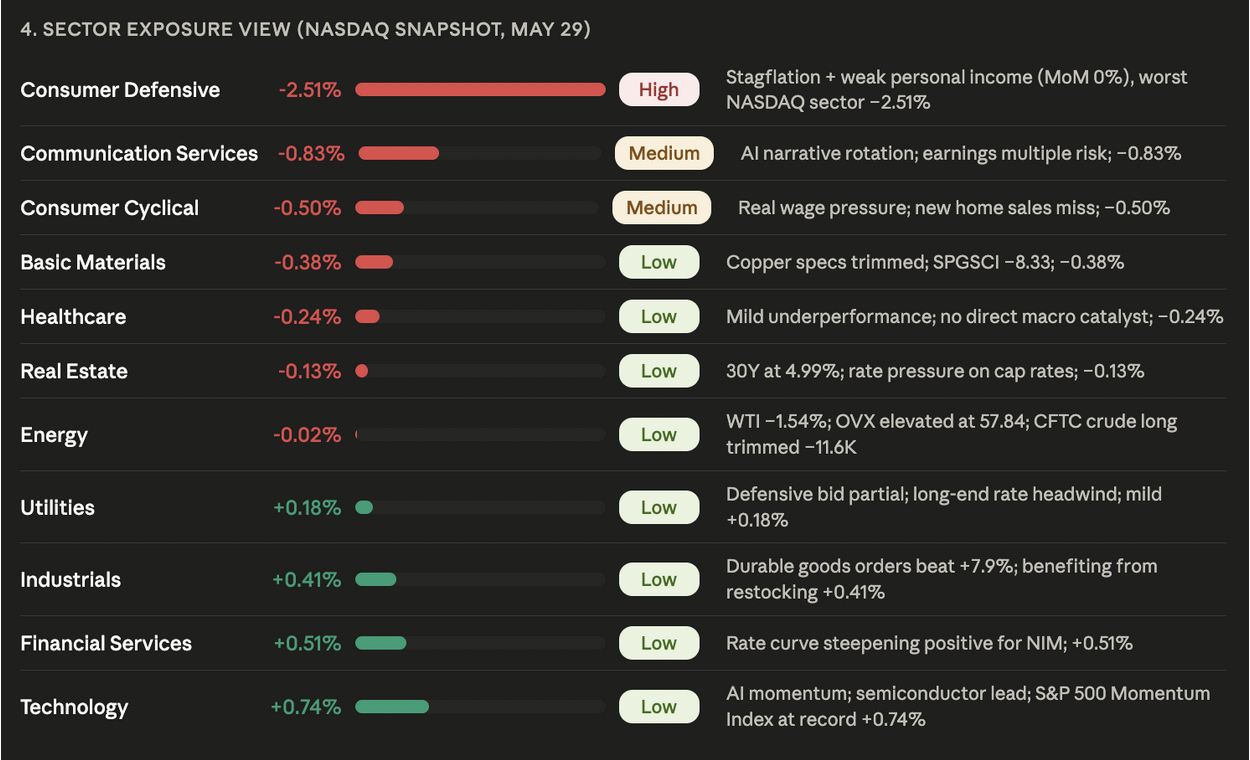
The figures referenced in this section come from the Claude run that produced the output shown in the screenshot below. They are included as a documented example of the workflow on the day of that run, not as a current market read.
Claude classified the market setup as Escalation Watch. The market did not show a clean risk-on or risk-off signal. Instead, several weaker signals appeared together across macro data, positioning, market breadth, UK fiscal stress, and rates.
The strongest warning came from the macro data. Claude's output reported US Q1 GDP at 1.6 percent, below a 2.0 percent consensus. Core PCE was at 3.3 percent year over year, and the PCE price index at 3.8 percent year over year. In simple terms, growth slowed while inflation stayed sticky, which makes policy decisions harder for the Federal Reserve.
Positioning data added to the cautious read. Per Claude's retrieved output, CFTC data showed S&P 500 net futures shorts moving from −140.6K to −165.8K over a one-week window. That kind of shift reflects institutional behavior rather than short-term noise.
Equity breadth looked weak beneath the surface. Claude's output flagged Nasdaq strength and momentum stocks supporting the headline market, while other areas showed pressure. Consumer Defensive declined 2.51 percent, the Russell 2000 fell 17 points, and Dow Jones Utilities dropped 6.24 points. The split matters because headline index strength can hide early deterioration underneath.
Claude also pointed to UK fiscal stress as a possible external channel. The output referenced rising gilt yields, Bank of England commentary, and FTSE weakness as contributing factors. This part of the read should be treated cautiously, since the supporting evidence within the retrieved FMP data is thinner than the macro and rates inputs. If the channel holds up, stress in UK rates can affect European credit markets and emerging-market risk sentiment, but the read depends on whether the supporting news and macro data align.
The Treasury curve added another signal. Per Claude's output, the curve remained upward-sloping, with the 3-month at 3.69 percent and the 30-year at 4.99 percent, and the long end had been re-steepening in the weeks leading up to the run. Long-end pressure of that kind can affect rate-sensitive sectors such as utilities, real estate, and financials.
The takeaway is straightforward. No single signal carried the full picture. When slower growth, sticky inflation, bearish positioning, narrow market leadership, possible UK fiscal stress, and long-end rate pressure appeared in the same run, the output had enough supporting evidence to flag escalation monitoring. That is the role of cross-asset interpretation with aligned FMP data. It connects scattered market signals into one likely-driver read for analyst review, rather than asserting what the market is doing or why.
Turning Market Signals Into Escalation Rules
A cross-asset monitoring system becomes more useful when it moves beyond signal detection. Analysts need to know which signals require attention, which ones need further review, and which ones can remain under observation. This is where escalation rules become important.
The first rule is confirmation across asset classes. A single weak equity move may not require escalation. But if equities weaken, crypto sells off, the dollar strengthens, and volatility rises at the same time, the signal becomes more serious. Multiple markets confirming the same direction usually gives the system stronger confidence.
The second rule is macro alignment. If market pressure appears alongside weaker growth, sticky inflation, central bank commentary, or a major economic release, the signal carries more weight. In the Claude output, slower GDP growth and firm inflation made the market setup more sensitive because they limited policy flexibility.
The third rule is sector spread. Stress in one sector may reflect a local issue. Stress across financials, utilities, real estate, industrials, and consumer-facing sectors can point to broader pressure. This helps the system separate isolated market moves from wider contagion.
The fourth rule is positioning confirmation. Price movement alone can mislead analysts during volatile sessions. Positioning data, such as changes in futures shorts, helps show whether institutional investors are also reducing risk. The same logic appears in insider activity and sector-level positioning, where raw transactions become more useful when they are translated into structured monitoring signals. When positioning confirms the price signal, escalation becomes more justified.
The fifth rule is external contagion. Not every risk starts in the main equity market. Currency stress, commodity shocks, sovereign yield pressure, or regional market weakness can spread into broader asset classes. In this case, UK fiscal stress created a possible channel that deserved monitoring beyond the local market.
These rules help convert market movement into a repeatable risk process. The system does not treat every red day as a crisis. It looks for confirmation, macro context, sector spread, positioning support, and contagion channels. When several of these conditions appear together, the signal moves from normal monitoring to escalation review.
Applying Cross-Asset Risk Reviews Across Teams
A cross-asset monitoring system becomes more valuable when teams can repeat the same logic every day. One analyst may review rates first, another may start with equities, and another may focus on macro news. That creates inconsistency. A structured system gives everyone the same starting point.
Standardizing Risk Interpretation
Enterprise risk teams need consistent language around market pressure. Labels such as Risk-Off, Defensive Rotation, or Escalation Watch help teams avoid vague interpretations. Instead of saying the market “looks weak,” the system explains what type of weakness appeared and which asset classes supported the signal.
This matters during volatile periods. When markets move quickly, teams need a shared structure for severity, confidence, affected sectors, and likely drivers. FMP data gives Claude the aligned inputs, while the MCP-based system turns those inputs into a repeatable risk view. This mirrors the structure used in analyst revision signal analysis, where rating changes, estimate revisions, and fundamentals need a common framework before they become reliable signals.
Reducing Manual Signal Matching
Cross-asset monitoring often requires analysts to compare several screens at once. They may check index movement, sector performance, currency shifts, commodity prices, Treasury rates, crypto behavior, and market news separately. That process can miss early connections.
The intelligent monitoring system reduces that gap. It brings related FMP datasets into one interpretation layer and checks whether signals confirm or contradict each other. This helps analysts focus less on collecting inputs and more on deciding whether the risk requires escalation.
Supporting Faster Escalation
The system also helps teams move faster from observation to action. If several asset classes confirm the same pressure point, the output can flag the signal for escalation review. If the evidence looks weak or isolated, the signal can remain under monitoring.
This makes the system useful for portfolio managers, research heads, risk teams, and market intelligence desks. They do not need a long market recap. They need to know what changed, why it matters, which sectors face pressure, and whether the signal deserves attention.
Creating a Repeatable Cross-Asset Review
Once the structure is defined, the same system can support daily market checks, intraday risk updates, sector surveillance, macro event monitoring, and executive briefings. The logic stays consistent even when market conditions change.
That repeatability is where FMP and Claude MCP become useful together. FMP provides the structured financial data layer, and Claude applies the escalation logic across asset classes. The result is a reusable cross-market intelligence layer that supports faster and more consistent risk monitoring. The same principle applies to earnings reaction analysis, where standardized inputs help teams compare events across companies, reporting periods, and market conditions.
Where Cross-Asset Risk Monitoring Needs Analyst Review
A cross-asset review can improve interpretation, but it cannot remove market uncertainty. It connects signals, assigns severity, and highlights escalation conditions. Even so, analysts need to understand where the workflow may overread or underread market pressure.
Correlation Can Mislead
Several asset classes can move together for a short period without sharing the same driver. Equities may fall, crypto may weaken, and the dollar may rise during the same session, but that does not always confirm a deep macro condition.
The review can reduce this risk by checking supporting evidence across FMP datasets. It looks at price action, sector spread, macro context, rates, news, and positioning before treating a signal as serious. Confidence levels matter here. A high-severity read with low confidence usually means the signals are correlated on the surface but lack supporting evidence underneath, which is exactly the case for further analyst review rather than escalation.
News Can Lag Market Movement
Market prices often react before the full explanation appears in news data. A sharp move in rates or commodities may start before analysts can clearly connect it to a headline, policy comment, or economic release.
This is why the review cannot depend only on the news input. News helps frame market behavior, but price action, sector movement, and rate changes still need separate attention.
Crypto Signals Need Careful Treatment
Crypto can help identify changes in liquidity and speculative appetite, but it does not always reflect broad market risk. Crypto sometimes moves because of regulation, exchange-specific issues, token events, or leverage resets.
The review treats crypto as a confirming signal, not a standalone driver. It becomes more useful when it aligns with equities, the dollar, rates, and broader risk appetite.
Commodity Moves Can Have Different Meanings
This is where the commodity-driven stress read from the framework section needs additional caution. A rise in oil can signal supply pressure, inflation concern, or stronger demand. A fall in industrial metals can point to weaker growth, but it can also reflect inventory shifts or China-specific developments.
That makes commodity interpretation sensitive to context. The read holds up better when macro news, sector reaction, and currency movement point in the same direction. On their own, commodity moves rarely justify escalation.
Data Alignment Still Matters
Even with a stronger FMP data layer, analysts need to review timing, market holidays, delayed releases, and symbol coverage. Cross-asset analysis depends on comparing signals across markets that do not all trade at the same time. Macro release timing also varies by region, and economic data points can land in the middle of a session or outside core market hours, which means the apparent confirmation between a release and a market move sometimes reflects timing rather than causation.
The review works best when analysts treat the output as a structured starting point, not a final answer. It points to where pressure may be building, but human review still matters before escalation decisions become formal.
From Disconnected Market Signals to Enterprise Risk Monitoring
Cross-asset risk becomes harder to interpret when every signal lives in a separate system. Equity weakness, dollar strength, commodity pressure, crypto volatility, rate movement, and macro news may all matter. But they become more useful when analysts can see how those signals connect.
That is the purpose of an MCP-based surveillance system built on FMP data. It gives Claude a structured financial data layer across markets and lets the system classify whether a setup reflects risk-on behavior, defensive rotation, commodity stress, dollar pressure, sector contagion, or escalation watch.
The real value comes from consistency. Analysts do not need to rebuild the same market check from scratch every day. They can use a repeatable risk monitoring layer that links market movement with likely drivers, affected sectors, severity, confidence, and escalation status.
This does not replace analyst judgment. It gives risk teams a stronger starting point. When cross-market pressure appears, the system helps analysts move from scattered observations to structured interpretation.
For teams that want to operationalize this type of market intelligence system, FMP's financial datasets and MCP access can support a scalable foundation. Teams can explore FMP pricing plans before building a broader monitoring setup across research, risk, and portfolio intelligence.

Financial APIs, Claude MCP, and AI-driven research workflows
Pranjal Saxena writes technical content focused on financial data APIs, Claude MCP workflows, AI-driven research systems, and Python-based market analysis. For FMP, his work centers on turning structured financial data into practical, workflow-driven content for developers, analysts, and fintech teams. He combines experience in data science, NLP, generative AI, and financial API workflows to show how APIs, automation, and AI-assisted systems can support modern financial research and analysis.
Related




Financial data for every need
Real-time quotes and 30+ years of historical data, including prices, fundamentals, and insider transactions — all accessible via API.
Create Free Account