Detect Valuation Disconnects Through Integrated Fundamental and Market Analysis

A stock trading below its DCF value, at a discount to peers, or at a low earnings multiple does not tell analysts much on its own. The same valuation gap can reflect genuine mispricing, weakening fundamentals, or a rational market discount for slower growth, weaker margins, or higher leverage. Without business quality context, the gap is just a number.
The more useful question is not whether a stock looks cheap or expensive. It is whether the valuation gap is supported or contradicted by the underlying business quality. A discount that aligns with weak margins and deteriorating growth is not mispricing. A discount that conflicts with stable profitability, clean balance sheet metrics, and improving expectations may deserve closer review.
That is where disconnected valuation processes fall short. Analysts often review market pricing, DCF references, peer multiples, profitability data, and expectations across separate tools or steps. The interpretation can then depend on which signal appears first, instead of how all signals fit together.
Financial Modeling Prep provides the data foundation for a more connected review: market pricing, DCF values, peer context, profitability ratios, leverage indicators, growth metrics, and analyst expectations. FMP's MCP server coordinates access across those datasets so Claude can organize the evidence and compare valuation signals against business quality indicators.
This article is not about screening for cheap stocks. It is about interpreting valuation gaps, especially when valuation and fundamentals point in different directions at the same time.
Why Valuation Analysis Breaks Down in Traditional Systems
Valuation analysis rarely fails because analysts lack data. It breaks down because connected inputs are often reviewed separately. Market pricing, DCF references, peer multiples, profitability data, leverage indicators, and analyst expectations may all sit in different tools or review steps. By the time they come together, the interpretation is already shaped by whichever signal received attention first.
That creates a disconnected view of valuation. A low EV/EBITDA multiple can look attractive before margin quality or leverage is reviewed. A DCF gap can suggest upside before analysts test whether the peer set is appropriate or whether the assumptions reflect the company's current trajectory. The issue is not the individual metric. It is the order and context in which the metric gets interpreted.
Data alignment adds another layer of risk. Valuation conclusions depend on inputs that correspond to the same company, reporting period, peer definitions, and metric conventions. Stale prices, inconsistent reporting periods, or poorly matched peers can create false disconnects. Each input may look reasonable on its own, but the combined conclusion can rest on a misaligned foundation.
A connected review process improves the starting point. It does not calculate another multiple for the sake of it. It helps analysts interpret conflicting signals together, with inputs aligned to the same company, period, and metric definitions. That makes it easier to see whether the gap between market pricing and business quality reflects a real valuation disconnect or a data artifact.
The Data Architecture Behind Valuation Interpretation
Interpreting a valuation gap requires more than a single multiple. To assess whether a discount or premium reflects genuine mispricing or a fundamentally justified market view, the review needs market pricing, an intrinsic value reference, peer context, operating quality indicators, growth trends, and analyst expectations, all aligned to the same company and reporting period. Each dataset contributes a distinct piece of the interpretive picture.
Here is how each data source contributes to the review.
The Market Anchor
Every valuation comparison starts with where the stock actually trades. The Stock Quote Short API provides the current market price and key market snapshot data, establishing the anchor against which DCF values, peer multiples, and analyst expectations are measured. Without a confirmed and current price, every subsequent comparison rests on an uncertain foundation.
An Intrinsic Value Reference
DCF analysis offers one way to estimate what a business might be worth based on its expected future cash flows. The DCF Valuation API provides that reference point, helping analysts compare where the stock trades against a model-based intrinsic value estimate. It is important to treat this as one input rather than a definitive fair value. DCF outputs depend on assumptions around growth rates, margins, discount rates, and terminal value, and those assumptions carry their own uncertainty. A large gap between market price and DCF value is a starting point for analysis, not a conclusion.
Relative Valuation Context
Peer comparison adds market context that intrinsic value models alone cannot provide. The Stock Peer Comparison API identifies relevant comparable companies so valuation multiples can be assessed against a peer group rather than in isolation. The reliability of this comparison depends on peer quality. A peer set that mixes companies with different business models, capital structures, or growth profiles can produce misleading relative valuation conclusions. When the peer group is well constructed, relative valuation helps identify whether a premium or discount is unusual given how the market prices similar businesses.
The Bridge Between Valuation and Operating Quality
Valuation multiples only become interpretable when they are read alongside the business quality they are supposed to reflect. The Key Metrics API and Financial Ratios API together provide that bridge, adding profitability, efficiency, liquidity, and leverage indicators that allow analysts to test whether a valuation gap conflicts with or confirms the company's operating profile. A discount that aligns with weak margins and deteriorating returns looks very different from a discount that contradicts stable profitability and improving capital efficiency.
Growth as Valuation Support or Concern
A premium valuation is easier to justify when growth is accelerating. A discount becomes harder to explain as opportunity when fundamentals are weakening. The Income Statement Growth API adds revenue, profit, and expense growth trends that help analysts assess whether the current valuation level is supported by improving fundamentals or is compressing alongside operational deterioration. Growth context is what separates a valuation case built on future potential from one where the market is correctly pricing a declining trajectory.
Analyst Expectation Context
Analyst price targets reflect how a community of external observers currently values the stock relative to their forward estimates. The Price Target Consensus API adds that expectation layer, showing the high, low, median, and consensus targets alongside the current market price. These targets are expectation context, not confirmation of upside or downside. A stock trading above consensus targets does not automatically mean it is overvalued, and a stock below consensus does not automatically mean it is cheap. What matters is whether the expectation gap aligns with or contradicts what the fundamental data shows.
Accessing FMP Data via Claude MCP
Running a valuation disconnect review through Claude starts with connecting Financial Modeling Prep's data layer through its MCP server. This connection gives Claude direct access to FMP's pricing, DCF, peer comparison, financial ratio, growth, and analyst expectation datasets without requiring manual API requests at each step of the review.
To set this up, you first need an active FMP API key, which can be generated from your Financial Modeling Prep dashboard. Once the key is available, connect FMP inside Claude using its remote MCP endpoint:
|
https://financialmodelingprep.com/mcp?apikey=YOUR_FMP_API_KEY |
In Claude, navigate to Settings → Connectors → Add custom connector, and paste this URL into the Remote MCP Server field. After saving, Claude will automatically discover the available FMP tools.
What MCP Is Coordinating
The connection itself is straightforward. What it enables for valuation disconnect analysis is more significant.
Once connected, Claude uses MCP to select and sequence the right FMP tools based on the valuation question being asked. For a valuation disconnect review, that sequence moves through the evidence in a logical order: confirming the current market price, retrieving a DCF reference for intrinsic value context, pulling peer comparison data, adding valuation metrics and profitability ratios, layering in margin, leverage, and growth indicators, checking analyst expectation data, and then organizing all of those inputs into a valuation classification.
What this means for the analyst is an integrated valuation interpretation layer rather than a manual stitching process. Instead of pulling market price from one source, retrieving DCF estimates from another, assembling peer multiples separately, and then checking financial ratios and analyst targets across additional steps, the analyst receives an organized output that compares those inputs together and identifies where they agree or conflict.
MCP does not determine whether a stock is mispriced or whether a valuation gap justifies an investment action. It coordinates data retrieval and organizes the evidence so that analyst judgment starts from a more complete and consistently assembled foundation.
Valuation Disconnect Framework
The useful question in valuation analysis is not whether a stock looks cheap or expensive. It is whether the valuation gap conflicts with business quality or whether business quality explains it. A discount that contradicts stable margins, strong profitability, and improving growth points in a different direction than a discount that aligns with leverage pressure, weakening returns, and deteriorating fundamentals.
Not every valuation gap deserves the same interpretation. The framework tests each case across profitability, margins, growth, leverage, analyst expectations, and peer context before assigning a classification. That evidence base is what separates a reasoned interpretation from a surface-level multiple comparison.
The four classification paths below are analyst interpretation categories, not automatic labels. Each one requires the valuation signal and the business quality evidence to point in the same direction before the classification holds.
Undervaluation
Undervaluation is not simply a stock trading below its DCF reference or at a discount to peers. It is a conflict between low market valuation and durable business quality. For this classification to hold, the discount needs to be contradicted by the underlying fundamentals, not just present alongside them.
The supporting evidence should include stable or improving margins, healthy profitability ratios, manageable leverage, consistent revenue and earnings growth, analyst expectations that remain constructive, and a DCF value that sits meaningfully above the current market price. When several of those conditions are present together and the valuation still sits at a discount, the case for genuine mispricing becomes stronger.
DCF upside alone is not sufficient. A DCF gap reflects model assumptions as much as it reflects market mispricing. The classification requires the fundamental evidence to independently support the conclusion that the market has discounted a business more than its operating quality warrants.
Overvaluation
Overvaluation is not a statement that a stock is expensive. It is a question of whether the premium the market is paying is still supported by the company's current operating profile and realistic forward expectations.
A stock can trade at a high multiple for legitimate reasons. Strong margins, accelerating growth, high returns on capital, and improving analyst expectations can all justify a premium. The classification becomes relevant when those conditions start to weaken. Slowing revenue growth, compressing margins, rising leverage, or moderating analyst targets can each reduce the fundamental support for a premium valuation without the market price reflecting that shift yet.
The overvaluation classification does not imply a directional call on the stock. It identifies a condition where the gap between market pricing and current business quality has widened in a way that warrants closer analyst attention before the next review period.
Valuation Deterioration
Valuation deterioration is distinct from both overvaluation and justified discounting. It describes a situation where the valuation multiple is compressing at the same time that fundamentals are weakening. The combination is what defines the category.
This classification matters because falling multiples can look attractive in isolation. A stock whose PE ratio has declined significantly over several quarters might appear to be moving toward value territory. But if that multiple compression is happening alongside declining margins, slower growth, lower profitability ratios, and weakening analyst expectations, the lower multiple may reflect a business that is getting worse rather than one that is getting cheaper relative to its quality.
Identifying valuation deterioration requires trend analysis across multiple periods rather than a single snapshot. A one-quarter margin decline or a single period of slower growth may not be sufficient. The classification strengthens when the direction of travel across fundamentals and valuation is consistently negative over time, suggesting the discount is developing alongside operational pressure rather than despite it.
Structurally Justified Discounting
Structurally justified discounting is the category most easily confused with opportunity. Some stocks look cheap on PE, EV/EBITDA, price-to-sales, or DCF comparisons, but the discount may be rational.
High leverage, inconsistent profitability, weak revenue growth, poor margins relative to peers, or low financial quality can each justify a lower valuation. When cheapness aligns with business weakness rather than contradicting it, the discount is not clear evidence of mispricing. It may be the market correctly pricing a lower-quality business.
This does not mean every discounted stock is a value trap. It means the discount needs to be tested against business quality before it is treated as an opportunity. A stock with a low valuation and improving margins belongs in a different category than one that looks inexpensive because the fundamentals support a lower price.
The most useful cases are the conflicting ones. A company may look attractive on a DCF comparison but weak on profitability and returns. It may look cheap on a trailing multiple but carry leverage that makes the balance sheet fragile. It may show analyst target upside while financial quality indicators point toward pressure. Those conflicts are what the framework is designed to surface.
Running the Claude MCP Prompt
AMD makes a more useful test case than a straightforward overvaluation or undervaluation example because the evidence does not point cleanly in one direction. The company has shown real fundamental improvement across revenue growth, margin recovery, and balance sheet quality, but its market price reflects expectations that go well beyond what current financials alone would justify. That combination, improving business quality alongside aggressive forward pricing, creates a genuine valuation interpretation problem where neither a DCF-only view nor a fundamentals-only view tells the complete story.
The prompt below asks Claude to use FMP data through MCP to retrieve AMD's current market pricing, DCF reference, peer comparison, profitability and margin data, leverage indicators, growth metrics, and analyst expectations, and then compare those valuation signals against operational quality before producing a classification. The goal is not to retrieve valuation data in isolation. It is to test whether the valuation gap conflicts with or is explained by the underlying business.
|
Use Financial Modeling Prep through MCP to analyze AMD as a valuation disconnect case. The goal is not to screen for cheap stocks. The goal is to determine whether AMD's current valuation reflects:
Retrieve and analyze FMP data where available for:
Build a valuation disconnect framework that compares valuation against operational quality. For each area, explain:
Please include these sections in the output:
|
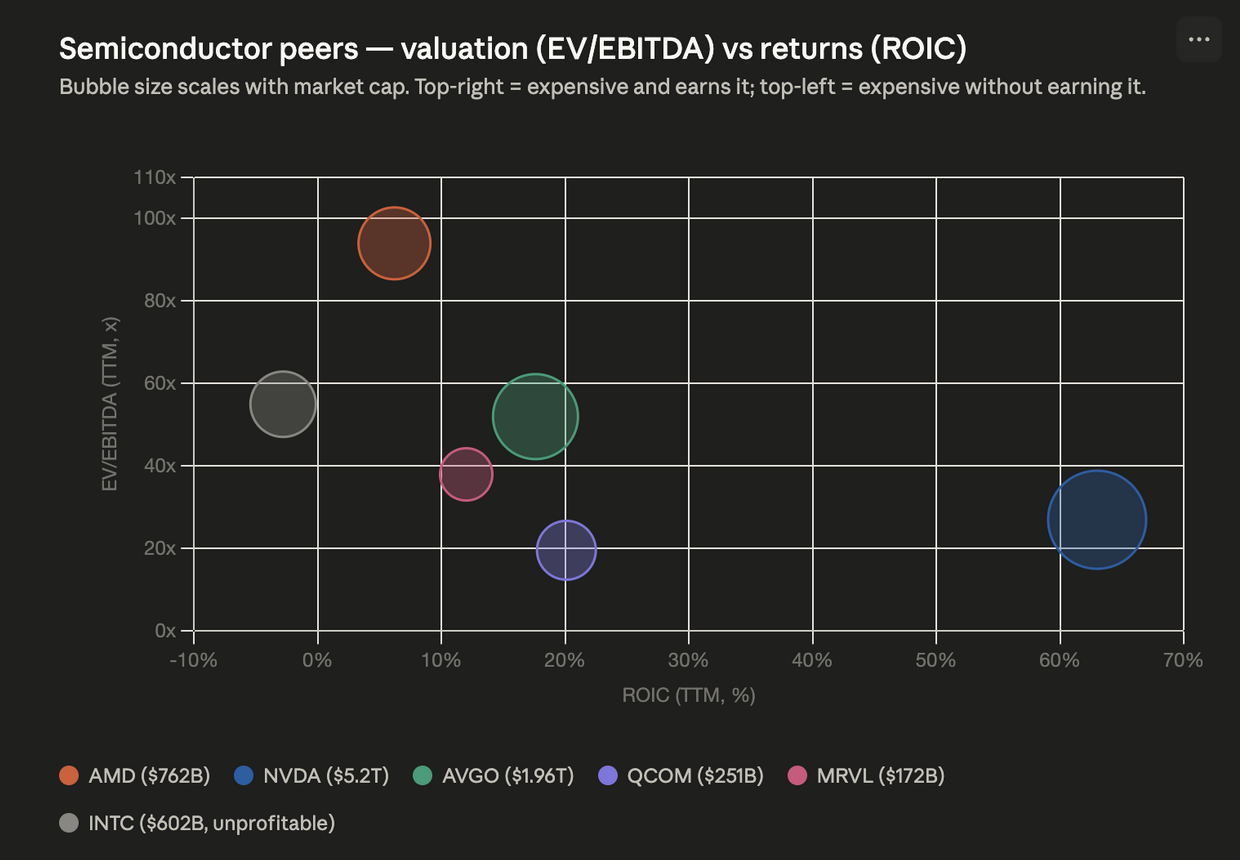
The output this prompt produces should be read as an analyst review layer, not an investment decision. Claude uses FMP data to compare market pricing with DCF references, peer multiples, profitability, leverage, growth, and analyst expectations, and then organizes those inputs into a valuation classification. The judgment about what the classification means and what action, if any, it warrants still belongs with the analyst reviewing the output.
What the prompt produces is a structured starting point: a connected view of valuation and business quality signals that shows where they agree, where they conflict, and which areas deserve closer attention before the next review.
Interpreting the Claude Output as a Valuation Risk Signal
AMD is useful for this review because the evidence does not point cleanly in one direction. The business showed genuine fundamental improvement across revenue growth, margin recovery, profitability, and balance sheet quality. At the same time, the market price reflected expectations that extended beyond what current financials alone could support.
That combination is where the valuation disconnect framework becomes useful. The question is not whether AMD is a good or bad business. It is whether the current valuation is already pricing in too much of the future improvement investors expect.
The interpretation below is based on the FMP data Claude retrieved through MCP at the time of review. Specific figures will change as market prices, DCF references, peer multiples, and analyst expectations update. The analytical logic remains the same.
The DCF Gap
The first disconnect appeared between AMD's market price and FMP's DCF reference. At the time of review, the gap was large enough to suggest that current cash flows did not explain the market price.
That does not automatically make the stock overvalued. DCF values depend on assumptions around future growth, margins, discount rates, reinvestment, and terminal value. A large gap should be treated as a question: does the rest of the evidence support the market's willingness to pay ahead of current fundamentals?
Peer Comparison and the Valuation Quality Mismatch
The peer comparison added context to that question. Claude compared AMD with relevant semiconductor peers across AI infrastructure exposure, data center growth, profitability, and margin quality.
The review showed a valuation quality mismatch. AMD's market valuation placed it closer to peers with stronger current profitability, higher returns on capital, and more established margin profiles than AMD had at the time of review.
That mismatch is not automatically negative. Markets often price improvement before it appears fully in reported financials. But it does mean the valuation depends on AMD continuing to close the gap between current operating quality and the peer-level profile implied by the market price.
Improving Fundamentals and Why They Matter for the Classification
Claude's output was not one-sided. The review found that AMD's fundamentals were genuinely improving at the time of analysis. Revenue had accelerated, margins had recovered from earlier pressure, net income had improved, and the balance sheet showed a net cash position with financial quality indicators pointing in a positive direction.
These are not minor details. They matter for the classification because they prevent the review from becoming a simple negative assessment. AMD is not a weak business being masked by a low multiple. It is a business with real momentum whose market price has moved faster than the operating evidence.
Analyst Expectations and the Execution Dependency
Analyst expectations added another layer to the interpretation. Claude found that the forward earnings path implied in analyst estimates required meaningful growth over the coming years to justify the current valuation level. That is not unusual for a company in AMD's position, but it does change the nature of the valuation case.
When a stock's current price already reflects a large portion of anticipated future improvement, the case becomes expectations-driven rather than fundamentals-driven. Analyst price targets and analyst estimates are expectation context, not proof of future performance. A stock trading at or above consensus analyst targets does not automatically mean it is overvalued, but it does mean the upside cushion has narrowed and the review priority should shift toward monitoring whether operating results are tracking the expected trajectory.
The relevant question for the next review is not whether analysts are right or wrong about the forward earnings path. It is whether the margin expansion, revenue growth, return on capital improvement, and AI accelerator adoption that the market appears to be pricing in are showing up in reported results as expected.
The Final Classification
Claude classified AMD as overvaluation with growth-priced-in characteristics at the time of review. That classification should not be read as a bearish call on the business.
The classification came from the combined evidence. The DCF gap showed that current cash flows did not explain the market price. The peer comparison showed that AMD was valued closer to companies with stronger current profitability and return profiles. The fundamental review showed real improvement, but not enough to fully close the gap between current operating quality and market expectations. Analyst expectations showed that the valuation depended on sustained execution over multiple years.
The useful output is the monitoring framework. AMD's valuation becomes more justified if margins expand, returns improve, AI-related revenue scales, and the gap between current fundamentals and market pricing narrows. It becomes harder to justify if those improvements fail to appear in future reporting periods.
From Valuation Metrics to Institutional Mispricing Analysis
Individual valuation inputs rarely tell a complete story on their own. A DCF gap points to something, but not to what. A peer discount raises a question, but does not answer it. A profitability ratio adds context, but without a valuation anchor, the interpretation remains incomplete.
The value of connecting these inputs is not in having more data. It is in testing whether valuation, profitability, growth, leverage, and analyst expectations agree or conflict. When the signals align, the interpretation becomes clearer. When they diverge, the review becomes more important.
What the System Standardizes
A standardized review process helps analysts apply the same checks across a defined peer group, sector, or watchlist. The goal is not to force every stock into a rigid classification. It is to make the first pass more consistent, so analysts start from the same interpretive foundation.
The core checks remain the same across companies:
- Market price versus DCF reference shows whether the stock trades above or below a model-based value estimate.
- Valuation multiples versus peer averages show whether the market assigns a relative premium or discount.
- Profitability, margin, and return metrics test whether business quality supports the valuation.
- Growth trends and analyst expectations show whether the market's forward assumptions look reasonable.
- Leverage and financial health add balance sheet context to the discount or premium.
None of these checks produces a final answer on its own. Together, they give analysts a more complete first-review picture before deeper work begins.
Why This Matters for Enterprise Research
The same valuation gap can mean different things across companies. A discount can signal genuine mispricing when business quality remains strong. It can also reflect a rational market penalty when margins are weak, leverage is high, or growth is slowing.
That distinction matters more when a team covers a larger peer group, sector, or watchlist. Without a consistent review structure, one analyst may treat a low EV/EBITDA multiple as an opportunity, while another may dismiss a premium valuation without checking whether growth and margin trends support it.
A connected review process makes those differences easier to compare. A discount that conflicts with strong profitability stands out more clearly. A premium that current operating quality does not yet support becomes easier to monitor. A valuation that depends heavily on future execution can be reviewed against margin expansion, return improvement, and revenue growth in the next reporting period.
How the AMD Review Fits
The AMD review showed why this structure matters. Improving fundamentals existed alongside aggressive forward pricing, which required a more specific classification than a simple cheap-or-expensive label.
The classification, overvaluation with growth-priced-in characteristics, does not resolve the investment question. It defines the monitoring framework: whether margin expansion, return on capital improvement, and revenue growth are tracking the trajectory the market appears to be pricing in.
Those same questions can apply across any peer group or watchlist where the initial review suggests valuation is running ahead of current fundamentals.
Where Valuation Disconnects Need Analyst Review
Structured valuation comparison improves interpretation consistency, but several limitations are worth understanding before treating the output as a final view.
DCF values are model outputs, not objective measures of fair value. They reflect assumptions around future growth, margins, discount rates, and terminal value. A large gap between market price and a DCF reference may say as much about the model's assumptions as it does about the market's pricing. Analysts should treat DCF output as one reference point rather than a valuation anchor.
Peer comparison can also mislead when the peer group is poorly constructed. A company may look expensive against one set of peers and reasonable against another. For AMD, comparing against a peer with unusually strong margins and returns sets a high bar that may not reflect the broader competitive context. The peer set needs to be appropriate before relative valuation conclusions carry much weight.
Markets sometimes price future optionality before it shows up in reported financials. A stock may carry a premium that current fundamentals do not yet support because investors are pricing an expected shift in the business, a new product cycle, or a sector-level re-rating. That narrative-driven valuation is difficult to capture through financial ratios and trailing metrics alone, which means the review output may understate the case for a premium in certain situations.
Claude's output should identify the nature of the disconnect and frame the right questions for analyst review. The judgment about what the disconnect means, whether it reflects genuine mispricing, rational market pricing, or something in between, belongs with the analyst, not with the review output.
From Cheapness to Structured Valuation Intelligence
A low multiple, a DCF gap, or a peer discount is a question, not an answer. The same signal can point to genuine mispricing, rational market discounting, or a business whose fundamentals are weakening. Business quality context determines which interpretation applies.
Financial Modeling Prep provides the foundation for that review: current pricing, DCF references, peer context, profitability ratios, leverage indicators, growth metrics, and analyst expectations. FMP's MCP server coordinates access across those datasets, while Claude organizes the evidence into a structured valuation classification.
The AMD review showed why this matters. The business had genuine fundamental improvement, but the market price already reflected a large amount of future execution. That produced a more useful interpretation than a simple cheap-or-expensive label and framed the right questions for the next review period.
For teams covering a peer group, sector, or watchlist, the same logic can run consistently across every company. As coverage expands, teams can review FMP's pricing plans to match data access with their dataset needs and review cadence.
The goal is analyst decision support: identifying which valuation gaps conflict with business quality, which are explained by it, and which deserve deeper review before the next reporting period closes.

Financial APIs, Claude MCP, and AI-driven research workflows
Pranjal Saxena writes technical content focused on financial data APIs, Claude MCP workflows, AI-driven research systems, and Python-based market analysis. For FMP, his work centers on turning structured financial data into practical, workflow-driven content for developers, analysts, and fintech teams. He combines experience in data science, NLP, generative AI, and financial API workflows to show how APIs, automation, and AI-assisted systems can support modern financial research and analysis.
Related




Financial data for every need
Real-time quotes and 30+ years of historical data, including prices, fundamentals, and insider transactions — all accessible via API.
Create Free Account