Build a Price Target Crowding Score

Price targets are widely used as directional indicators of where analysts believe a stock is headed. Investors often focus on the average price target as a summary of market expectations. However, this average alone does not reveal how those expectations are distributed. In many cases, multiple analysts may arrive at very similar target levels, creating a tightly clustered consensus that reflects crowding rather than independent viewpoints. For example, two stocks may both have an average price target of $150, but in one case analysts may cluster tightly around that level, while in another case targets may range widely from $120 to $180. Despite having the same average, the underlying consensus structure is very different, highlighting why averages alone can be misleading.
This clustering behavior carries important information. When price targets are closely grouped, it can indicate strong agreement among analysts, but it can also suggest that the market narrative has become crowded. In contrast, a wider spread in targets may reflect uncertainty, differing assumptions, or a lack of clear consensus. Understanding this distinction helps move beyond simple averages toward a more structured interpretation of analyst behavior.
In this article, we build a Price Target Crowding Score using the Price Target Summary API from Financial Modeling Prep. The goal is to quantify how tightly analysts cluster around similar price levels by combining participation and dispersion signals derived from time-based price target data. This approach provides a more nuanced view of analyst consensus and helps identify situations where market expectations may be overly concentrated.
Financial Modeling Prep APIs Used
In this article, we use Financial Modeling Prep APIs to analyze how analyst price targets evolve over time. Instead of relying on a single average value, we work with structured summary data to understand analyst participation and consensus behavior across different time horizons.
Price Target Summary API: The Price Target Summary API provides an aggregated view of analyst price targets for a given stock. It includes the number of analysts contributing to price targets and the average target values across multiple time windows such as the last month, quarter, year, and all available history.
How to Get Your API Key
To access Financial Modeling Prep's APIs, you need a valid API key.
Create an account using the official registration page.
After registration, your API key will be available in your dashboard. Replace "YOUR_API_KEY" in the code examples below with your personal key to authenticate requests.
Defining the Price Target Crowding Framework
Analyst price targets are often interpreted through their average value, which provides a single-point estimate of expected price movement. However, this average does not capture how those expectations are distributed across analysts. Two stocks may have similar average price targets, yet the underlying analyst opinions can differ significantly depending on how tightly those targets are clustered.
To address this, we define a framework that moves beyond averages and focuses on consensus structure. In this context, crowding refers to situations where analysts converge around similar price levels with limited variation. This convergence can indicate strong agreement, but it may also suggest that market expectations have become concentrated around a common narrative.
Since individual analyst-level price target distributions are not directly available, we approximate crowding using time-based summary data. This means the measure reflects a proxy for dispersion based on how expectations evolve over time, rather than the true cross-sectional spread of analyst targets at a single point in time. The key idea is to evaluate how stable price targets remain across different time windows and how many analysts are contributing to those targets.
The framework is built on two core components:
Analyst Participation
Analyst participation reflects how many analysts are contributing to the price target consensus. A higher number of analysts increases the strength of the signal, as it indicates broader coverage and greater agreement across the analyst community. In contrast, a low number of analysts may lead to unstable or less reliable consensus. In this framework, we use recent participation (lastMonthCount) rather than total historical coverage, as it better reflects current analyst engagement and avoids signals driven by stale or outdated estimates.
Dispersion Proxy Across Time
In the absence of individual-level price target data, dispersion is approximated by comparing average price targets across different time horizons, such as the last month and the last year. This approach captures how analyst expectations change over time, rather than measuring disagreement between analysts at a single point in time. If average targets remain relatively stable across these windows, it suggests that analysts are converging around similar expectations. Larger differences indicate shifts in expectations and a wider spread in implied views.
By combining participation and dispersion signals, we construct a structured view of analyst crowding. This approach allows us to identify situations where price targets appear consistent on the surface but differ in the strength and concentration of underlying analyst consensus.
Building the Price Target Crowding Score
With the framework defined, we now move to constructing a measurable crowding score using price target summary data. The goal is to translate analyst participation and dispersion signals into a structured metric that reflects how tightly analysts cluster around similar price levels.
The score is built in a step-by-step manner. First, we retrieve time-based price target data for a given stock. Then, we derive features that capture analyst participation and variation in price targets across different time horizons. Finally, we combine these features into a single crowding score that allows for comparison across companies.
This approach keeps the methodology transparent while ensuring that each component of the score is directly tied to observable data fields. Rather than relying on opaque calculations, we use simple, interpretable transformations that reflect how analyst consensus evolves over time.
Step 1: Retrieve Price Target Summary Data
We begin by fetching price target summary data using the Financial Modeling Prep API. This provides aggregated analyst targets across multiple time windows along with participation counts.
|
import requests import pandas as pd API_KEY = "YOUR_API_KEY" symbol = "AAPL" url = f"https://financialmodelingprep.com/stable/price-target-summary?symbol={symbol}&apikey={API_KEY}" response = requests.get(url) data = response.json() df = pd.DataFrame(data) df |
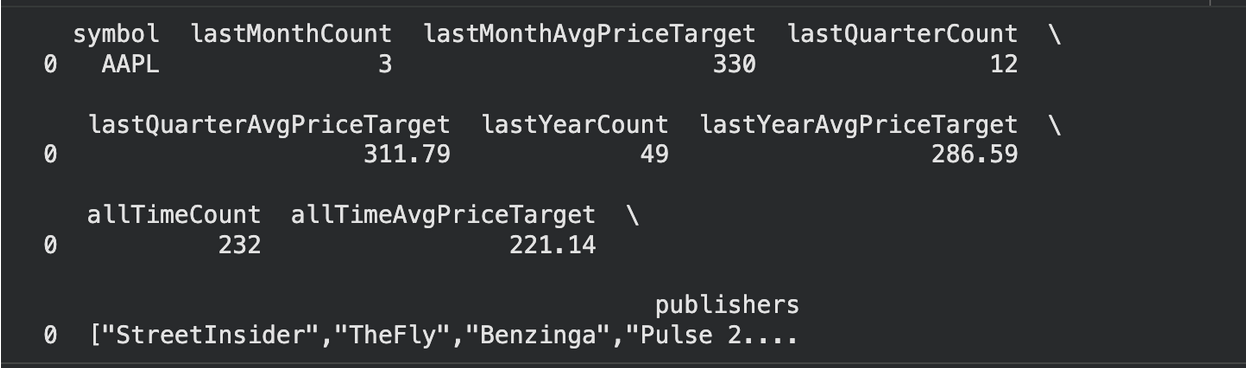
This dataset contains aggregated price target metrics across multiple time windows, which form the basis for both participation and dispersion signals used in the analysis.
The retrieved dataset contains average price targets and analyst counts across different time horizons, including the last month, last quarter, last year, and all available history.
This structure forms the foundation for building participation and dispersion features in the next step.
Step 2: Build Participation and Dispersion Features
With the price target summary data available, we now construct the key features required to measure analyst crowding. These features translate raw API fields into signals that reflect participation strength and the stability of analyst expectations over time.
|
import numpy as np # Analyst Participation (recent focus) df["participation_score"] = df["lastMonthCount"] # Dispersion Proxy (difference between short-term and long-term targets) df["dispersion_proxy"] = abs( df["lastMonthAvgPriceTarget"] - df["lastYearAvgPriceTarget"] ) # Normalized Dispersion (to stabilize scale) df["normalized_dispersion"] = df["dispersion_proxy"] / ( df["lastYearAvgPriceTarget"] + 1e-6 ) # Clustering Score (inverse of dispersion) df["clustering_score"] = 1 / (1 + df["normalized_dispersion"]) df[ [ "symbol", "participation_score", "dispersion_proxy", "normalized_dispersion", "clustering_score", ] ] |

The clustering_score represents the inverse of dispersion, where values closer to 1 indicate tighter alignment in analyst expectations, while values closer to 0 indicate greater variation.
The participation score captures recent analyst coverage, while the dispersion proxy measures how much short-term expectations differ from longer-term targets. By normalizing this difference and converting it into a clustering score, we obtain a signal that reflects how tightly analyst expectations are grouped. Higher clustering combined with strong participation indicates a more concentrated and stable consensus.
Together, these features provide a structured representation of how concentrated analyst expectations are, preparing us to combine them into a final crowding score.
Step 3: Construct the Price Target Crowding Score
With participation and clustering signals in place, we combine them into a unified Price Target Crowding Score. The score increases when analyst coverage is strong and price targets remain tightly clustered, while lower values reflect weaker participation or higher variation in expectations.
|
import numpy as np # Log-scaled participation (to avoid dominance by very large analyst counts) df["log_participation"] = np.log1p(df["participation_score"]) # Final Crowding Score df["crowding_score"] = df["log_participation"] * df["clustering_score"] df[ [ "symbol", "participation_score", "clustering_score", "crowding_score", ] ] |

Log scaling is applied to analyst participation because coverage can vary significantly across companies, and this transformation prevents highly covered stocks from disproportionately dominating the final score.
The clustering_score represents the inverse of dispersion, where values closer to 1 indicate tighter alignment in analyst expectations, while values closer to 0 indicate greater variation.
The crowding score combines participation and clustering into a single metric that reflects consensus strength. Log-scaling prevents extremely high analyst counts from dominating the score, ensuring stability across companies with different coverage levels. Higher values indicate tightly aligned expectations supported by strong participation, while lower values reflect weaker consensus or greater dispersion in analyst views.
Step 4: Rank Companies by Crowding Score
To make the crowding score more actionable, we extend the analysis to multiple companies and compare how analyst consensus differs across them. Ranking companies based on the crowding score helps identify where expectations are most concentrated versus where views remain more dispersed.
|
symbols = ["AAPL", "MSFT", "NVDA", "GOOGL"] all_data = [] for symbol in symbols: url = f"https://financialmodelingprep.com/stable/price-target-summary?symbol={symbol}&apikey={API_KEY}" response = requests.get(url) data = response.json()
if data: all_data.extend(data) df_multi = pd.DataFrame(all_data) df_multi.head() |

We apply the same feature engineering and scoring logic to compute the crowding score for each company.
|
# Participation df_multi["participation_score"] = df_multi["lastMonthCount"] # Dispersion Proxy df_multi["dispersion_proxy"] = abs( df_multi["lastMonthAvgPriceTarget"] - df_multi["lastYearAvgPriceTarget"] ) # Normalized Dispersion df_multi["normalized_dispersion"] = df_multi["dispersion_proxy"] / ( df_multi["lastYearAvgPriceTarget"] + 1e-6 ) # Clustering df_multi["clustering_score"] = 1 / (1 + df_multi["normalized_dispersion"]) # Log Participation df_multi["log_participation"] = np.log1p(df_multi["participation_score"]) # Final Score df_multi["crowding_score"] = ( df_multi["log_participation"] * df_multi["clustering_score"] ) # Ranking df_multi_sorted = df_multi.sort_values( by="crowding_score", ascending=False ) df_multi_sorted[ [ "symbol", "participation_score", "dispersion_proxy", "clustering_score", "crowding_score", ] ] |
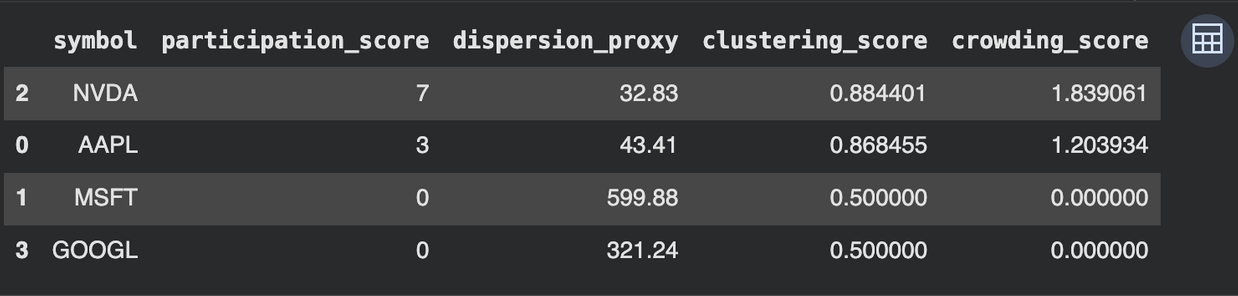
The ranking highlights how analyst consensus varies across companies. Higher crowding scores indicate stronger participation combined with tightly aligned price targets, reflecting a more concentrated consensus. Lower scores suggest either weaker analyst coverage, greater dispersion in expectations, or both. This comparison provides a structured way to identify where analyst views are most stable and where uncertainty remains higher.
NVDA emerges as the most crowded stock in this sample, driven by the highest recent analyst participation and relatively low dispersion, indicating strong consensus in price target expectations.
In contrast, MSFT and GOOGL show zero recent analyst participation, which drives their crowding scores to zero despite having computed dispersion values. A zero participation score effectively nullifies the crowding signal, reflecting a deliberate emphasis on recent analyst activity rather than historical coverage, and should be interpreted as a modeling choice rather than a true absence of analyst attention. This reinforces that crowding depends not only on how closely price targets align but also on whether analysts are actively contributing to the consensus in the current period.
Mini Case Study: Similar Price Targets, Different Crowding
To understand why crowding matters, consider two companies with similar directional price target expectations but different underlying analyst behavior.
NVDA and AAPL both show relatively stable price target trends over time, indicating that analysts broadly agree on their expected valuation ranges. However, NVDA has a higher number of analysts contributing in the recent period, which strengthens the consensus signal. This results in a higher crowding score, reflecting a more concentrated and actively supported view among analysts.
In contrast, AAPL shows a comparable level of stability in price targets but lower analyst participation. While the targets appear aligned, the consensus is supported by fewer contributors, making it less crowded in comparison. This distinction highlights why average price targets alone can be misleading, as they do not capture the strength or breadth of agreement behind those numbers.
For example, NVDA records a crowding score of 1.83 with participation from 7 analysts, compared to AAPL at 1.20 with participation from 3 analysts, illustrating how higher analyst activity combined with tighter clustering leads to stronger crowding signals.
When the Crowding Score Can Be Misleading
While the Price Target Crowding Score provides a structured way to evaluate analyst consensus, it is important to understand the limitations of the underlying data and methodology.
One key limitation is that the score relies on aggregated price target data rather than individual analyst-level distributions. As a result, dispersion is approximated using differences across time windows rather than the true spread of analyst price targets at a given point in time. This means the score may not fully capture situations where analysts are widely dispersed but recent averages appear stable.
Another scenario where the score can be misleading is during periods of low or uneven analyst coverage. As seen in the earlier results, companies with zero recent analyst participation receive a crowding score of zero, even if historical consensus exists. This makes the score sensitive to short-term participation gaps, which may not always reflect a genuine lack of analyst interest.
Finally, the score does not account for differences in analyst quality, institutional influence, or the assumptions behind price targets. All analyst contributions are treated equally, even though some may carry more weight in practice. As a result, the score should be interpreted as a directional indicator of consensus concentration rather than a definitive measure of market conviction.
Conclusion
Price targets are often interpreted through their average value, but this approach overlooks how analyst expectations are distributed. By focusing on participation and time-based variation in price targets, the Price Target Crowding Score provides a more structured way to evaluate how tightly analysts cluster around similar views.
Using Financial Modeling Prep's Price Target Summary API, we built a simple and transparent framework to approximate consensus crowding without relying on individual analyst-level data. This allows analysts and investors to move beyond surface-level averages and better understand whether market expectations are broadly aligned or still evolving.
While the score has its limitations, it offers a practical starting point for identifying situations where consensus may be concentrated. Combined with further analysis, it can help highlight where expectations are strong, and where divergence may still present opportunities.
Frequently Asked Questions
1. What is a Price Target Crowding Score?
A Price Target Crowding Score measures how tightly analysts cluster around similar price targets. It combines analyst participation and dispersion signals to evaluate the strength and concentration of consensus.
2. Why is the average price target not enough?
The average price target provides a single summary value but does not show how analyst opinions are distributed. Multiple analysts may arrive at similar averages while having very different underlying views.
3. What does a high crowding score indicate?
A high crowding score indicates strong analyst participation combined with tightly aligned price targets. This suggests a concentrated consensus where analysts share similar expectations.
4. Can a low crowding score still be meaningful?
Yes. A low score may indicate fewer analysts or greater variation in price targets. This can reflect uncertainty, changing expectations, or a lack of strong consensus.
5. How often should this score be updated?
The score can be updated regularly as new analyst data becomes available. Tracking it over time helps identify shifts in consensus and changes in analyst behavior.
6. What are the limitations of this approach?
The score is based on aggregated data rather than individual analyst-level targets. Dispersion is approximated using time-based changes, which may not fully capture the true spread of analyst opinions.

Financial APIs, Claude MCP, and AI-driven research workflows
Pranjal Saxena writes technical content focused on financial data APIs, Claude MCP workflows, AI-driven research systems, and Python-based market analysis. For FMP, his work centers on turning structured financial data into practical, workflow-driven content for developers, analysts, and fintech teams. He combines experience in data science, NLP, generative AI, and financial API workflows to show how APIs, automation, and AI-assisted systems can support modern financial research and analysis.
Related




Financial data for every need
Real-time quotes and 30+ years of historical data, including prices, fundamentals, and insider transactions — all accessible via API.
Create Free Account