Build a Valuation Snapshot Card for Any Stock

Valuation work often starts with scattered data—price on one screen, ratios on another, and fundamentals buried in filings. That slows decision-making, especially when the goal is a quick, defensible first view of a stock.
A valuation snapshot card solves this problem. It compresses the most decision-relevant valuation signals into a single, structured view that an analyst can scan in seconds. Not to replace deep models, but to triage ideas, compare names, and identify where deeper work is justified.
In this article, we build such a snapshot programmatically using Financial Modeling Prep APIs. The focus stays practical: a small, high-signal metric set, clean data assembly, and an output format that fits naturally into an analyst's workflow. The end result is a reusable valuation card that can be generated for any stock on demand.
Next, we define the valuation framework that determines what belongs on the card—and what does not.
Establishing the Valuation Framework
Before pulling any data, the framework matters more than the numbers. A valuation snapshot works only if it stays focused, comparable, and interpretable.
What the Snapshot Is Designed to Do
This card answers one question quickly: Is this stock cheap, expensive, or fairly valued relative to its fundamentals?
It is not a full valuation model and does not aim to forecast price targets.
Metric Selection Principles
To keep the snapshot effective, every metric must satisfy at least one of these:
- Reflect market pricing
- Capture operating performance
- Indicate capital efficiency or balance-sheet risk
If a metric does not influence an analyst's first-pass judgment, it does not belong on the card.
For example, highly granular turnover ratios or multi-year CAGR fields—while useful in deeper fundamental models—do not materially improve a rapid valuation read. Including such metrics would dilute clarity rather than enhance decision quality.
Core Metric Groups in the Snapshot
The valuation snapshot is built around four tightly scoped groups:
- Market context: price, market capitalization
- Valuation multiples: P/E, EV/EBITDA, P/S
- Efficiency & profitability: ROE / ROIC
- Risk & quality signals: leverage indicators, rating score
This structure ensures the snapshot remains compact while still covering pricing, quality, and risk in one view.
With the framework fixed, the next step is to map each metric group to reliable, real-time data sources.
Data Sources and APIs Used
This valuation snapshot is built using the following Financial Modeling Prep Stable APIs:
-
Quote API: Provides the latest stock price and real-time market context.
-
Company Profile API: Returns company-level fundamentals such as market capitalization, sector, and industry.
-
Key Metrics (TTM) API: Delivers trailing twelve-month valuation metrics including P/E, EV/EBITDA, and price-to-sales ratios.
-
Financial Ratios (TTM) API: Provides profitability, efficiency, and leverage ratios such as ROE, ROIC, and debt-to-equity.
-
Ratings Snapshot API: Offers a consolidated rating score and valuation sub-scores for quick qualitative assessment.
This set of APIs ensures the valuation snapshot card remains compact, consistent, and fully reproducible for any stock symbol.
Constructing the Valuation Snapshot Dataset Using Python
At this stage, the objective is simple: one ticker in, one clean snapshot dataset out. No fragmented scripts. One continuous flow that mirrors how an analyst would assemble data.
Setup and Ticker Selection
We start by defining the ticker and a shared request helper so every API call stays consistent.
|
import requests import pandas as pd API_KEY = "YOUR_FMP_API_KEY" BASE_URL = "https://financialmodelingprep.com/stable" TICKER = "AAPL" def fetch(endpoint, symbol): params = {"symbol": symbol, "apikey": API_KEY} r = requests.get(f"{BASE_URL}/{endpoint}", params=params, timeout=20) r.raise_for_status() data = r.json() # Stable endpoints sometimes return list or dict if isinstance(data, list) and len(data) > 0: return data[0] elif isinstance(data, dict): return data else: return {} |
Pull Core Market and Company Data
These fields anchor the snapshot to current market context.
|
quote = fetch("quote", TICKER) profile = fetch("profile", TICKER) |
Pull Valuation and Ratio Metrics
These APIs populate the valuation and efficiency layers of the card.
|
key_metrics = fetch("key-metrics-ttm", TICKER) ratios = fetch("ratios-ttm", TICKER) ratings = fetch("ratings-snapshot", TICKER) |
Consolidate Into a Single Snapshot Structure
All values are merged into one dataframe—this becomes the backend of the valuation card.
|
snapshot = { "Price": quote.get("price"), "Market Cap": profile.get("marketCap"), # Valuation "P/E (TTM)": ratios.get("priceToEarningsRatioTTM"), "EV/EBITDA (TTM)": key_metrics.get("evToEBITDATTM"), "P/S (TTM)": ratios.get("priceToSalesRatioTTM"), # Yield View "Earnings Yield (TTM)": key_metrics.get("earningsYieldTTM"), "FCF Yield (TTM)": key_metrics.get("freeCashFlowYieldTTM"), # Returns (pull BOTH from key_metrics) "ROE (TTM)": key_metrics.get("returnOnEquityTTM"), "ROIC (TTM)": key_metrics.get("returnOnInvestedCapitalTTM"), # Leverage "Debt-to-Equity (TTM)": ratios.get("debtToEquityRatioTTM"), # Rating "Overall Rating": ratings.get("rating") } snapshot_df = pd.DataFrame(snapshot, index=[TICKER]) snapshot_df |

At this point, we have a fully assembled valuation snapshot dataset—compact, readable, and consistent across stocks.
In the AAPL example, several signals stand out immediately. The P/E multiple reflects a premium valuation relative to the broader market, while return metrics such as ROIC and ROE indicate strong capital efficiency. The combination of elevated valuation multiples and high return quality suggests that the market is pricing in durability rather than cyclical expansion.
This illustrates how the snapshot moves beyond raw numbers—it highlights the relationship between price and performance before any deeper modeling begins.
Next, we enhance this dataset by deriving actionable valuation indicators that help interpret what the numbers are actually signaling.
Deriving Actionable Valuation Indicators
Now we convert raw metrics into decision-ready signals (yields + simple flags). These sit on top of the same snapshot_df we already built.
1) Add Compact Analyst Flags (Fast Triage)
These are deliberately simple so the card stays readable. In the code, threshold levels (such as 30x P/E or 18x EV/EBITDA) are heuristic first-pass markers commonly used in rapid screening workflows. They are not valuation conclusions, but simple reference bands that help identify when a stock may warrant closer review relative to broad large-cap norms.
|
def flag_valuation(pe, ev_ebitda): if (pd.isna(pe) and pd.isna(ev_ebitda)): return "Insufficient Data" if (not pd.isna(pe) and pe >= 30) or (not pd.isna(ev_ebitda) and ev_ebitda >= 18): return "Potentially Expensive" if (not pd.isna(pe) and pe <= 15) or (not pd.isna(ev_ebitda) and ev_ebitda <= 10): return "Potentially Undervalued" return "Neutral Range" def flag_leverage(dte): if pd.isna(dte): return "Unknown" return "Higher Leverage" if dte >= 1.5 else "Manageable Leverage" def flag_quality(roic, roe): if pd.isna(roic) and pd.isna(roe): return "Unknown" if (not pd.isna(roic) and roic >= 0.12) or (not pd.isna(roe) and roe >= 0.15): return "Strong Returns" return "Moderate Returns" # Create working copy for signal generation df = snapshot_df.copy() df["Valuation Flag"] = df.apply(lambda r: flag_valuation(r["P/E (TTM)"], r["EV/EBITDA (TTM)"]), axis=1) df["Leverage Flag"] = df["Debt-to-Equity (TTM)"].apply(flag_leverage) df["Quality Flag"] = df.apply(lambda r: flag_quality(r["ROIC (TTM)"], r["ROE (TTM)"]), axis=1) |

2) Keep the Card Output Clean
|
card_cols = [ "Price", "Market Cap", "P/E (TTM)", "EV/EBITDA (TTM)", "P/S (TTM)", "Earnings Yield (TTM)", "FCF Yield (TTM)", "ROIC (TTM)", "ROE (TTM)", "Debt-to-Equity (TTM)", "Overall Rating", "Valuation Flag", "Quality Flag", "Leverage Flag" ] valuation_card_df = df[card_cols] valuation_card_df |

Presenting the Valuation Snapshot Card
Now we convert the dataset into a clean, “card-style” output that reads well in notebooks and can be exported later.
1) Create a Card-First View (formatted + compact)
|
card = valuation_card_df.copy() def fmt_money(x): if pd.isna(x): return "—" x = float(x) return f"${x/1e12:.2f}T" if x >= 1e12 else ( f"${x/1e9:.2f}B" if x >= 1e9 else f"${x/1e6:.2f}M") def fmt_pct(x): if pd.isna(x): return "—" return f"{float(x)*100:.1f}%" def fmt_num(x, d=2): if pd.isna(x): return "—" return f"{float(x):.{d}f}" # ---- Formatting existing columns ---- card["Market Cap"] = card["Market Cap"].apply(fmt_money) card["Earnings Yield (TTM)"] = card["Earnings Yield (TTM)"].apply(fmt_pct) card["FCF Yield (TTM)"] = card["FCF Yield (TTM)"].apply(fmt_pct) card["ROIC (TTM)"] = card["ROIC (TTM)"].apply(fmt_pct) card["ROE (TTM)"] = card["ROE (TTM)"].apply(fmt_pct) card["Debt-to-Equity (TTM)"] = card["Debt-to-Equity (TTM)"].apply(lambda x: fmt_num(x, 2)) card["P/E (TTM)"] = card["P/E (TTM)"].apply(lambda x: fmt_num(x, 1)) card["EV/EBITDA (TTM)"] = card["EV/EBITDA (TTM)"].apply(lambda x: fmt_num(x, 1)) card["P/S (TTM)"] = card["P/S (TTM)"].apply(lambda x: fmt_num(x, 1)) # ---- Correct Ratings Snapshot fields ---- card["Rating"] = ratings.get("rating") card["Overall Score"] = ratings.get("overallScore") card["DCF Score"] = ratings.get("discountedCashFlowScore") card["ROE Score"] = ratings.get("returnOnEquityScore") card["ROA Score"] = ratings.get("returnOnAssetsScore") card["D/E Score"] = ratings.get("debtToEquityScore") card["P/E Score"] = ratings.get("priceToEarningsScore") card["P/B Score"] = ratings.get("priceToBookScore") card |
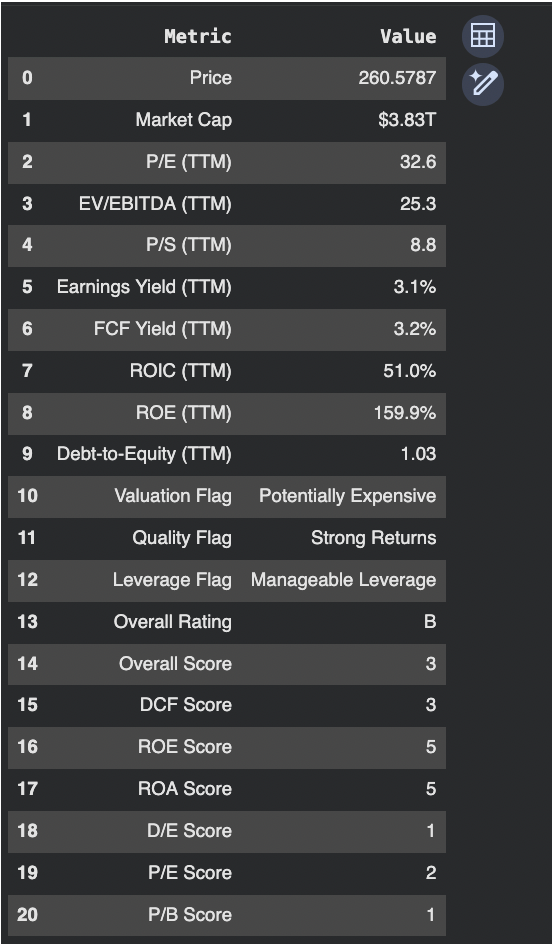
That output is the final valuation snapshot card: one row, readable formatting, and a scoring overlay from Ratings Snapshot.
In practice, an analyst can use this card as a rapid triage tool. When reviewing a watchlist of 20-50 stocks, the formatted snapshot allows immediate comparison of valuation multiples, return quality, and leverage posture without reopening multiple data sources.
It also supports idea screening workflows—flagging names that appear richly valued despite strong returns, or discounted despite stable capital efficiency. The card does not replace deep modeling, but it sharply reduces the time required to decide where deeper analysis should be allocated.
2) Clean Vertical Valuation Card
|
# Drop duplicate column safely clean_df = card.drop(columns=["Rating"], errors="ignore") # Define desired order card_order = [ "Price", "Market Cap", "P/E (TTM)", "EV/EBITDA (TTM)", "P/S (TTM)", "Earnings Yield (TTM)", "FCF Yield (TTM)", "ROIC (TTM)", "ROE (TTM)", "Debt-to-Equity (TTM)", "Valuation Flag", "Quality Flag", "Leverage Flag", "Overall Rating", "Overall Score", "DCF Score", "ROE Score", "ROA Score", "D/E Score", "P/E Score", "P/B Score" ] # Keep only columns that actually exist existing_cols = [col for col in card_order if col in clean_df.columns] vertical_card = ( clean_df.loc[[TICKER], existing_cols] .T .reset_index() .rename(columns={"index": "Metric", TICKER: "Value"}) ) vertical_card |
Interpreting the Valuation Snapshot in Practice
The valuation snapshot is designed as an analytical filter. It provides a consolidated view of pricing, capital efficiency, balance-sheet risk, and model-based scoring in a single structure.
Valuation Context
The starting point is the pricing layer: P/E, EV/EBITDA, and P/S. These ratios indicate how the market is valuing earnings, operating cash flow, and revenue. The yield metrics complement these multiples by expressing valuation in return terms. Together, they establish whether the stock trades at a premium or discount relative to its financial output.
Elevated multiples should be assessed alongside operating strength. Compressed multiples require examination of underlying business quality rather than immediate classification as value.
Capital Efficiency and Return Quality
ROIC and ROE provide insight into how effectively management deploys capital. Sustained return metrics materially above the cost of capital support premium valuations. Conversely, weaker return profiles often justify discounted pricing.
Return metrics add structural depth to valuation analysis by linking market price to capital productivity.
Balance Sheet Considerations
Debt-to-Equity provides context for valuation and return metrics. Leverage alters risk exposure and impacts the sustainability of returns. A valuation assessment without capital structure context is incomplete.
The leverage flag incorporated in the card serves as a quick risk indicator rather than a conclusion.
Model-Based Rating Overlay
The Ratings Snapshot introduces a structured scoring layer. The overall rating and component scores (DCF, ROE, ROA, D/E, P/E, P/B) offer a standardized perspective derived from multiple valuation dimensions.
The rating should be treated as an analytical supplement. It highlights areas that may require further review rather than replacing independent judgment.
In practice, the valuation snapshot is most effective when used as:
- A first-pass screening mechanism
- A watchlist monitoring tool
- A structured starting point for deeper fundamental review
It accelerates comparison across securities while maintaining analytical discipline.
When This Snapshot Needs Expansion
While the valuation snapshot provides a disciplined first-pass framework, certain scenarios require deeper analysis. In cyclical industries, trailing multiples can compress or expand dramatically depending on where the company sits in the earnings cycle, making simple P/E or EV/EBITDA thresholds potentially misleading.
Companies with negative earnings or unstable cash flows may render traditional valuation multiples unusable or distorted. Similarly, high-growth businesses often trade at structurally elevated multiples that reflect reinvestment intensity and future optionality rather than near-term profitability.
In these cases, the snapshot should serve as a starting point rather than a conclusion. Adjusting the framework to emphasize growth durability, unit economics, or forward estimates may be necessary to preserve analytical accuracy.
Conclusion
A valuation snapshot card consolidates pricing, capital efficiency, balance-sheet structure, and model-based scoring into a single analytical view. It does not replace full valuation models or detailed financial analysis. Instead, it standardizes the first stage of review.
By structuring core valuation metrics through Financial Modeling Prep's stable APIs, the process becomes repeatable and scalable across tickers, with plan-level data access and request capacity shaping how broadly you can deploy the same workflow across larger watchlists. The result is a consistent framework that supports screening, comparison, and prioritization without sacrificing analytical rigor.
By structuring core valuation metrics through Financial Modeling Prep's stable APIs, the process becomes repeatable and scalable across tickers. Instead of toggling between multiple dashboards to review pricing, ratios, and ratings separately, an analyst can screen a 20-stock watchlist in minutes using a standardized snapshot format.
The result is a consistent framework that supports screening, comparison, and prioritization without sacrificing analytical rigor. Used appropriately, the valuation snapshot improves speed while preserving discipline—bringing structure to what is often an unstructured starting point in equity analysis.

Financial APIs, Claude MCP, and AI-driven research workflows
Pranjal Saxena writes technical content focused on financial data APIs, Claude MCP workflows, AI-driven research systems, and Python-based market analysis. For FMP, his work centers on turning structured financial data into practical, workflow-driven content for developers, analysts, and fintech teams. He combines experience in data science, NLP, generative AI, and financial API workflows to show how APIs, automation, and AI-assisted systems can support modern financial research and analysis.
Related




Financial data for every need
Real-time quotes and 30+ years of historical data, including prices, fundamentals, and insider transactions — all accessible via API.
Create Free Account