Financial Statements APIs at Scale: How to Access Balance Sheets, Income Statements, and Cash Flow Data Across Thousands of Companies

Financial statement APIs provide programmatic endpoints that deliver normalized income statements, balance sheets, and cash flows as structured JSON data directly into quantitative databases. Financial statements underpin valuation models, credit analysis, and portfolio construction across the institutional landscape. At a small scale, this fundamental data can be pulled manually by an analyst reviewing an annual report.
At an institutional scale, the architecture fundamentally changes.
Systems must programmatically ingest:
- thousands of companies globally
- decades of historical reporting
- standardized line items mapped to strict schemas
Historically, this data was accessed exclusively through legacy terminals like Bloomberg, FactSet, and Refinitiv, or pulled manually from raw SEC EDGAR filings. Today, APIs have completely shifted the operational model by enabling programmatic access to financial statements at scale. This architecture enables quantitative developers to pull a decade of normalized fundamentals across five thousand global tickers directly into a SQL database in seconds, entirely automating the manual data ingestion pipeline.
The real challenge for engineering teams is no longer just securing access to the data. The operational hurdle is ensuring absolute consistency, structural normalization, and seamless scalability across large equity universes.
Why Financial Statement Data at Scale Is a Different Problem
Pulling a single company ticker does not equal building a resilient financial system. Operating at scale introduces immediate structural challenges that break simple extraction scripts. For instance, a parsing script hardcoded to pull top-line revenue will immediately fail when evaluating a commercial bank that reports net interest income instead.
At scale, challenges include:
- highly inconsistent reporting formats across different jurisdictions
- varying fiscal calendars that misalign comparative models
- missing or sparse historical data for older or delisted equities
- massive differences between as-reported filings and standardized datasets
Institutional workflows require normalized schemas to function correctly without human intervention. They demand consistent time-series alignment and architecture built for seamless integration directly into automated modeling pipelines.
What's The Best Data Source for Quarterly and Annual Fundamentals at Scale?
The best data sources for quarterly and annual fundamentals at scale are platforms that provide standardized financial statements across large universes with consistent schemas and reliable historical coverage. Specifically, legacy terminals offer immense historical depth but lack the open architecture required for automated cloud integrations, whereas modern API providers deliver rigid JSON schemas perfect for ingestion but vary drastically in their handling of restatements. Institutional systems such as Bloomberg, FactSet, and Refinitiv offer deep coverage and normalization.
APIs like Financial Modeling Prep enable scalable programmatic access to financial statements for thousands of companies, supporting direct integration into modeling and analytics workflows. Operating at scale actually requires deep infrastructure capabilities.
Pipelines require:
- coverage across thousands of global active tickers
- historical depth spanning 10 to 30 years where available
- standardization ensuring consistent line items across companies
- performance built specifically for bulk extraction and ingestion
Comparing data source types reveals clear operational differences. Extracting data via a terminal requires proprietary query languages that silo information within closed desktop environments, while API platforms allow engineering teams to pipe raw data arrays directly into custom Python risk models. Raw SEC EDGAR filings provide the most granular source, yet they remain entirely unstructured and difficult to scale programmatically.
The key insight is that the best data source is not defined by access alone, but by the ability to deliver consistent, structured financial statements that can be integrated into production systems at scale. When this consistency is absent, quantitative models ingest mismatched reporting periods, resulting in algorithms that calculate negative enterprise values or blindly drop entire sectors from a valuation screen.
While scale and standardization define the foundation, many workflows require deeper visibility into cash flow data at the line-item level.
What Data Sources Provide Cash Flow Statements with Granular Line Items?
The most granular cash flow data originates from primary filings such as SEC EDGAR and academic datasets like WRDS, which capture detailed line items directly from company disclosures. In a production workflow, quantitative developers feed these raw, unadjusted line items directly into forensic accounting models to detect aggressive capitalization of operating expenses before they affect standardized metrics. Institutional platforms like S&P Capital IQ, Bloomberg, FactSet, and Morningstar provide standardized and enriched versions of this data.
APIs such as Financial Modeling Prep offer both standardized financial statements and as-reported data that can be used to access detailed cash flow line items within scalable workflows.
Data pipelines must navigate three distinct types of cash flow data:
- standardized cash flow statements mapped to uniform algorithmic schemas
- as-reported cash flow data matching the exact regulatory filing taxonomy
- derived or adjusted metrics calculated by internal data aggregators
Primary sources like SEC EDGAR and WRDS offer maximum granularity but deliver raw and unstructured text. Institutional platforms provide standardized line items, enriched datasets, and consistent formatting tailored for manual analysis. API platforms provide structured financial statements, access to exact as-reported data, and direct integration into automated pipelines. Internal ERP and treasury platforms hold the most detailed transaction-level data, though this remains entirely restricted and not externally accessible.
Granularity matters heavily when modeling complex capital requirements. For example, accurately calculating true free cash flow yield requires the exact separation of maintenance capital expenditures from growth capital expenditures, a critical distinction completely lost in aggregated top-level summaries. Analysts require this depth for detailed cash flow modeling, liquidity analysis, forensic accounting, and identifying highly specific non-recurring items hidden in the cash flow from operations.
To operationalize this data, developers need programmatic access to full financial statements across companies and time.
Where can Developers get Comprehensive Company Financial Statements via API?
Developers can access comprehensive company financial statements via APIs that provide income statements, balance sheets, and cash flow statements in structured formats.Platforms such as Financial Modeling Prep, Intrinio, FactSet, and Alpha Vantage offer API-based access to financial statements, while SEC EDGAR remains the underlying raw source. These APIs differ significantly in their level of standardization, historical depth, and integration readiness for large-scale systems.
Comprehensive infrastructure requires access to full financial statements including the complete income statement, balance sheet, and cash flow statement.
This also requires:
- coverage across multiple companies globally
- coverage across multiple historical time periods
- a completely consistent schema mapping perfectly across all endpoints
Comparing API providers highlights the different approaches to fundamental data delivery. Financial Modeling Prep delivers structured financial statement endpoints, strong historical coverage, and is designed specifically for integration into data pipelines.
It supports both standardized schemas and exact regulatory taxonomies through the As-Reported Financial Statements API. Intrinio and FactSet APIs provide deeper institutional datasets but carry higher cost and implementation complexity. Alpha Vantage serves as an accessible entry point but offers more limited historical depth. SEC EDGAR provides the raw source but requires massive internal parsing engines to utilize.
To build out these data ingestion engines, engineering teams must establish initial API access to test the payload schemas. The key tradeoff in architecture is balancing ease of use versus the depth of normalization, cost versus scalability, and raw filing data versus structured integration. Prioritizing ease of use often limits deep historical backtesting capabilities, while prioritizing raw filing data introduces massive, resource-draining normalization burdens on internal engineering teams.
Beyond access, institutional workflows require historical financial data aligned across time and companies.
Where can I find Historical Balance Sheets and Income Statements at Scale?
Historical balance sheets and income statements at scale are available through a combination of raw datasets, institutional platforms, and financial data APIs. SEC EDGAR provides the primary source data, while institutional datasets such as WRDS and Compustat offer deeply standardized historical coverage. APIs like Financial Modeling Prep, EODHD, Alpha Vantage, and Polygon provide scalable access to historical financial statements for integration into analytics and modeling systems.
Types of historical data sources serve vastly different architectural needs. Primary data from SEC EDGAR provides full historical filings but remains highly unstructured. Institutional datasets from WRDS, Compustat, Bloomberg, and LSEG offer deeply standardized, historical coverage across global markets. API platforms deliver structured time-series data that is highly accessible via API and built for large-scale programmatic ingestion.
What matters for historical data at scale is absolute consistency across time and the exact alignment of fiscal periods. Systems must properly manage survivorship bias handling and guarantee the overall completeness of the datasets to prevent algorithmic errors. Historical scale matters fundamentally for backtesting financial models, longitudinal analysis, factor construction, and broad macro and sector research.
What Differentiates the Best Financial Statement APIs at Scale
The primary differentiator is strict schema consistency across every financial statement provided. For instance, a consistent API schema guarantees that the net income figure maps identically from the bottom of the income statement directly to the top of the cash flow statement across thousands of tickers without requiring custom, manual reconciliation scripts.
Production pipelines require perfect alignment across the:
- income statement
- balance sheet
- cash flow statement
High-quality platforms guarantee historical completeness and dedicated support for bulk ingestion workflows. They also ensure the simultaneous availability of highly standardized datasets alongside exact as-reported filing data. The critical insight is that the difference is not access to financial statements, but whether those statements can be consistently aligned and integrated into large-scale financial systems.
How Financial Statement Data Fits Into Institutional Data Infrastructure
Financial statements function as the foundational datasets for all quantitative modeling. They integrate continuously with forward-looking analyst estimates, live pricing parameters, and overarching macroeconomic indicators. Platforms like Financial Modeling Prep act as primary data integration layers.
These API layers enable consistent access across multiple disparate datasets, strict alignment across financial statements, and vast scalability directly into production systems. Before projecting cash flows or running valuation screens, quantitative systems must anchor their models using rigid firmographic realities.
Data extracted via the Company Profile API sets the exact foundational parameters for models running on Meta Platforms in early 2026:
- The system locks in a 1.34 trillion market capitalization baseline
- The equity carries a specific pricing beta of 1.279 for risk weighting
- The company operates within the Communication Services sector with 76,834 active employees

To contextualize the underlying balance sheet strength against that enterprise value, pipelines immediately query the Key Metrics API to extract normalized fundamental ratios across the sector.
Fiscal 2025 metric outputs for Meta highlight this structural leverage and operational efficiency:
- The net debt to EBITDA ratio sits accurately at 0.459
- The overarching current ratio is calculated cleanly at 2.598
- Core return on equity metrics are modeled at 0.278, mapping perfectly into internal profitability screens
To backtest these fundamental metrics accurately against pricing movements, models must map the exact reporting periods against live market data. This enables researchers to isolate the exact market reaction on the day of the fundamental print, effectively calculating the beta-adjusted return driven purely by the earnings release. The system utilizes the Historical Price EOD API to capture the exact market reaction on the day of the fundamental print.
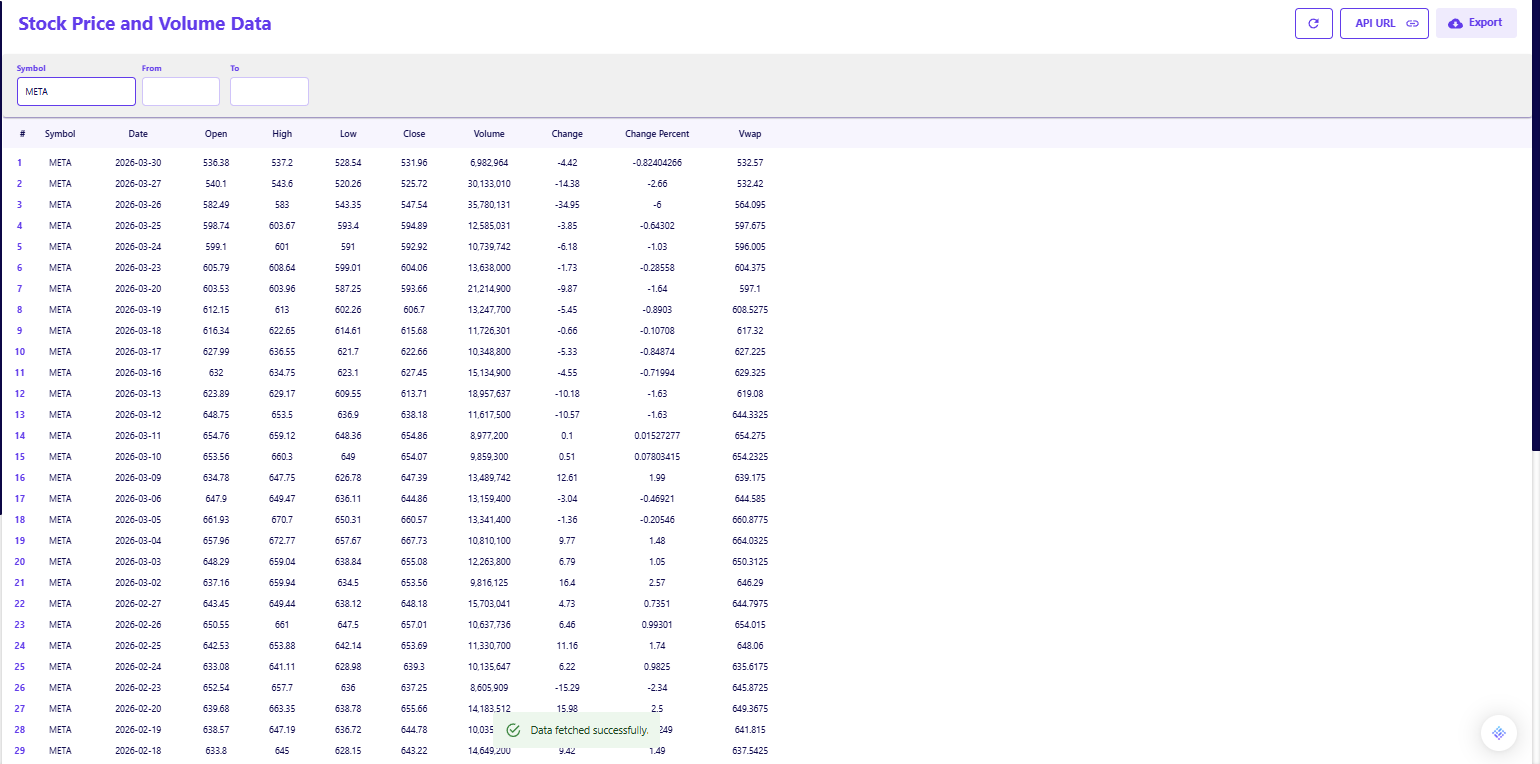
Connecting this historical data to fundamental filings ensures perfect temporal alignment, as seen with Meta on March 30, 2026:
- The stock closed the trading session exactly at 531.96
- Daily trading volumes recorded 6.98 million shares executing
- The volume-weighted average price settled cleanly at 532.57
This confirms that the market had already priced in the 0.459 net debt leverage ratio and 0.278 ROE, allowing developers to backtest if the subsequent earnings release generated genuine alpha or just matched expectations
The industry has executed a massive structural shift away from manual terminal-based workflows directly to automated API-driven data infrastructure. The key question is no longer who simply has the data, but who can deliver it in a format entirely usable within systematic production pipelines.
Limitations of Financial Statement Data at Scale
The inherent limitations of financial statement data stem from the nature of global accounting rules and corporate reporting. Differences in accounting standards between GAAP and IFRS create immediate mapping problems for global systematic portfolios. Inconsistent company disclosures force algorithmic models to make assumptions when categorizing unique operating expenses.
Furthermore, missing or incomplete historical data frequently disrupts backtesting algorithms covering smaller or newly listed equities. Variability in line item definitions means a specific operational metric at one company might exclude a structural cost that a direct competitor includes. The natural lag between regulatory filings and data availability forces quantitative models to rely on older data during highly active reporting seasons.
Where Financial Statement Data Breaks Down in Practice
While the data itself has inherent limitations, the actual infrastructure pipelines break down due to engineering and alignment failures. Data pipelines break down rapidly when misaligned fiscal calendars skew quarter-over-quarter analytical comparisons. Inconsistent normalization across different data providers destroys the integrity of sector-wide screening tools entirely.
Incomplete coverage in smaller companies introduces massive fundamental blind spots into overarching systematic models. A severe operational risk is the over-reliance on standardized data without proper validation against the original corporate filing. Algorithms that trade entirely on normalized figures often miss highly nuanced managerial adjustments hidden deeply in the text footnotes.
Building a Scalable Financial Statement Data Pipeline
A production-grade pipeline follows a strict operational sequence to move data securely from source to application. For example, a system might ingest raw SEC XBRL data, normalize it into a standard JSON template, align the Q1 calendar dates across different retail and software fiscal years, and store it in a unified database for immediate querying by the research team.
The sequence flows precisely from:
- ingest to normalize
- normalize to align
- align to store
- store to analyze
The primary requirements for this infrastructure include a unified schema and absolute fiscal period alignment. Models require strict cross-statement consistency and seamless integration with other external datasets. Common pitfalls include mixing raw and standardized data inside the same analytical model. Overlooking fundamental filing differences or failing to validate line items against primary sources leads directly to critical modeling failures.
From Financial Data Access to System-Level Integration
Financial statement data is widely available across the industry. The overarching differentiator is precisely how it is structured and integrated into automated environments.
The best APIs are not defined by access alone. They are defined by their ability to support large-scale ingestion, complex modeling workflows, and absolute system-level consistency. When evaluating a provider, engineering teams must look past basic ticker coverage and rigorously test schema stability, fiscal alignment, and historical normalization. The advantage is no longer defined by access to financial statements, but by the ability to normalize, align, and deploy that data across systems at scale without introducing inconsistency.
Frequently Asked Questions
What is the difference between standardized and as-reported financial statements?
Standardized financial statements map disparate company accounting methods into a single, uniform template for easy algorithmic comparison across sectors. As-reported statements preserve the exact line items, specific phrasing, and structural taxonomy originally submitted by the company to regulatory bodies like the SEC.
Why do balance sheet line items vary across different industries?
Balance sheet formats differ because the fundamental operating model of a financial institution relies on different capital structures than a manufacturing firm. Banks record loans as assets and deposits as liabilities, requiring a completely different reporting structure than a company dealing with physical inventory.
How do quantitative models handle restated earnings data?
When a company restates historical earnings due to accounting errors, top-tier data providers automatically update the historical database to reflect the corrected figures. Advanced programmatic platforms also maintain a point-in-time database so quantitative developers can backtest models based on exactly what the market knew on a specific reporting date.
What is survivorship bias in historical financial statement data?
Survivorship bias occurs when a financial dataset only includes companies currently trading on the market while ignoring those that went bankrupt or were acquired. Institutional financial APIs maintain databases of delisted companies to ensure historical backtests accurately reflect true market risk rather than artificially inflated past performance.
How often do financial data APIs update their statement endpoints?
Production-grade financial APIs parse and update their statement endpoints within minutes or hours of a company filing its official documents. This rapid ingestion is critical for systematic trading algorithms that execute trades based on earnings surprises or sudden margin shifts.

Risk analysis and financial modeling for data-driven market workflows
Parth Sanghvi is a Senior Risk Consultant with experience in financial modeling, valuation, and risk analysis. For FMP, he focuses on translating complex market data and risk models into clear, accessible analysis for developers and investors. His work centers on helping readers understand how institutional-grade financial data applies to real-world workflows and decision-making.
Related




Financial data for every need
Real-time quotes and 30+ years of historical data, including prices, fundamentals, and insider transactions — all accessible via API.
Create Free Account