


Every trading day, a handful of equities dictate the broader market narrative. Identifying these "market movers"—the biggest gainers, the steepest losers, and the most heavily traded assets—is crucial for analysts gauging market sentiment and developers building financial dashboards.
Instead of scraping finance portals or manually calculating daily volatility, you can use a free API to retrieve these datasets programmatically. This approach provides structured, ready-to-use data that serves as a snapshot of market activity. While building continuous, reactive models requires a premium real-time data feed, this free snapshot is ideal for powering lightweight dashboards or executing periodic data pulls to monitor broader momentum shifts.
The Math Behind the Momentum
Before retrieving the data, it is important to understand the calculations driving these lists. Market movers are defined by two distinct metrics:
- Percent Change (Intensity): This calculation ranks the top gainers and losers by dividing the difference between the current price and the previous close by the previous close. It isolates current session price movement relative to the previous close, leveling the playing field so a $2 penny stock and a $500 mega-cap can be compared purely on relative momentum.
- Volume Rankings (Conviction): The "most active" list ignores price entirely and ranks equities strictly by daily trading volume. High volume indicates significant liquidity and active institutional or retail interest.
(Note: These datasets represent daily snapshots of market activity that reset at the start of each trading session. They capture current intraday momentum, which does not inherently predict long-term historical trends.)
Securing Your API Access
Pulling this data programmatically requires an API key to authenticate your requests. Financial Modeling Prep offers access to market mover datasets directly on its free pricing tier. Once registered, you can immediately begin querying the endpoints below.
Retrieving and Analyzing the Datasets
With your API key ready, you can query three specific endpoints. This workflow is best suited for prototyping dashboards or building lightweight analytics before scaling to higher-frequency or multi-asset premium systems. The true value of this data lies in combining the outputs to understand the catalysts behind the market's most aggressive moves.
Tracking the Top Gainers
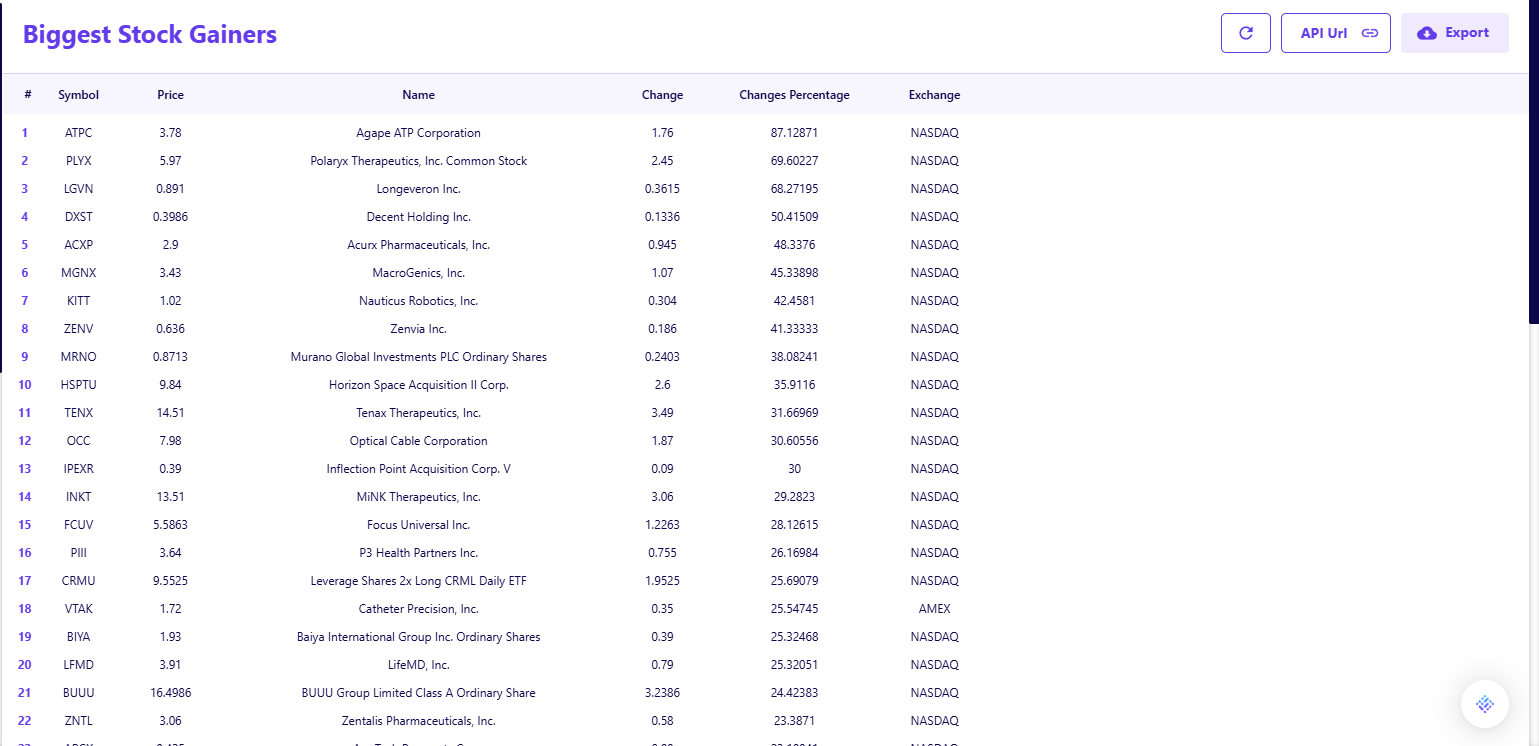
The Biggest Gainers API returns a ranked array of equities exhibiting the highest positive percentage change. For example, recent snapshot data highlights Agape ATP Corporation (ATPC) leading the market with an intraday surge of over 87%.
- Screening for Catalysts: nalysts use this data as a primary filter to identify notable daily movers that may reflect reactions to recent events.
- Periodic Checks: Integrating this endpoint allows basic monitoring scripts to flag hyper-volatile assets for fundamental review.
Identifying the Biggest Losers
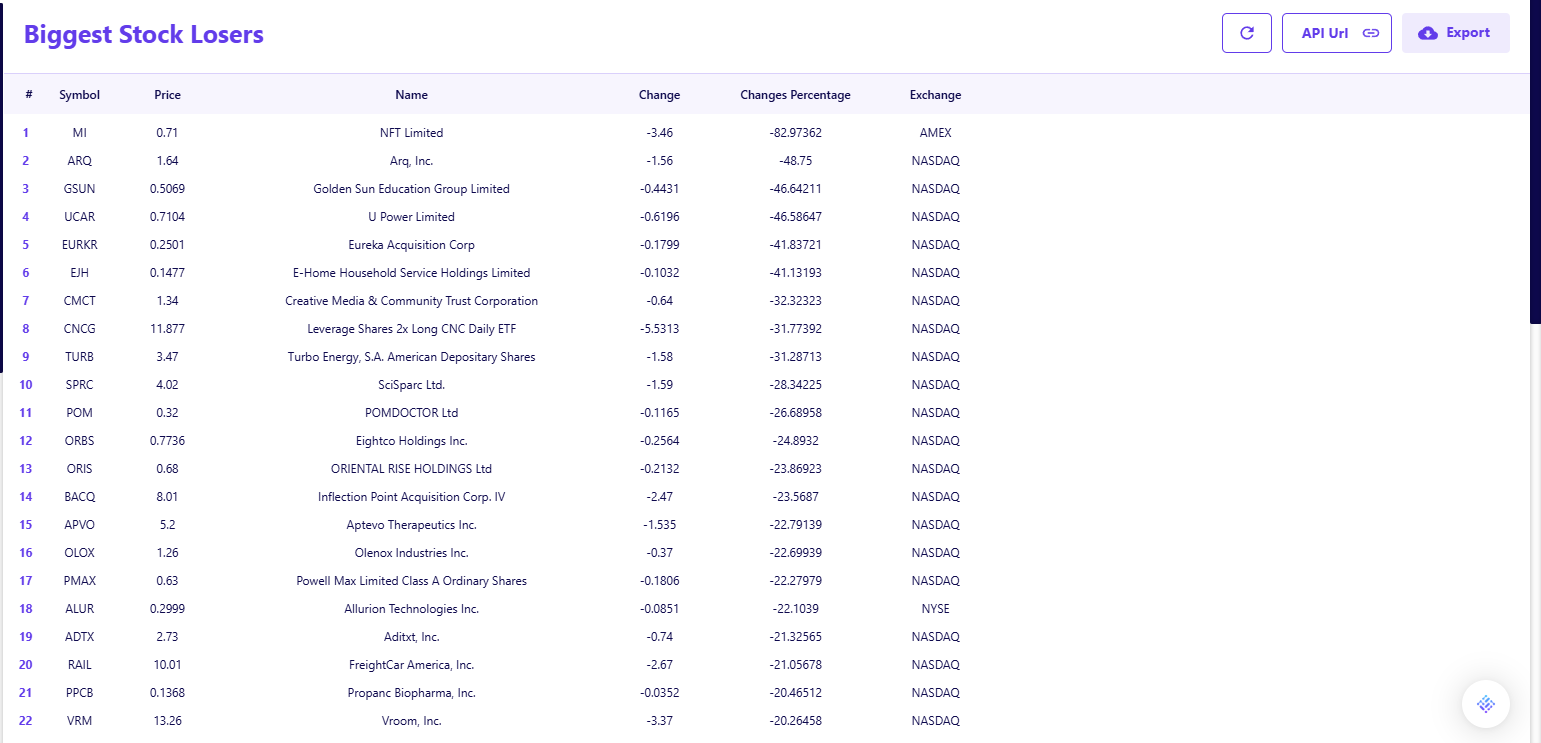
The Biggest Losers API tracks equities facing the steepest daily declines. A recent query shows NFT Limited (MI) dropping by nearly 83% during a single session.
- Capitulation Screening: Value investors monitor the biggest losers to find assets that may have been severely oversold due to temporary panic rather than structural failure.
- Risk Management: Portfolio managers use this list to identify sector-specific contagion, ensuring their holdings are shielded from rapidly depreciating asset classes.
Monitoring the Most Active Stocks
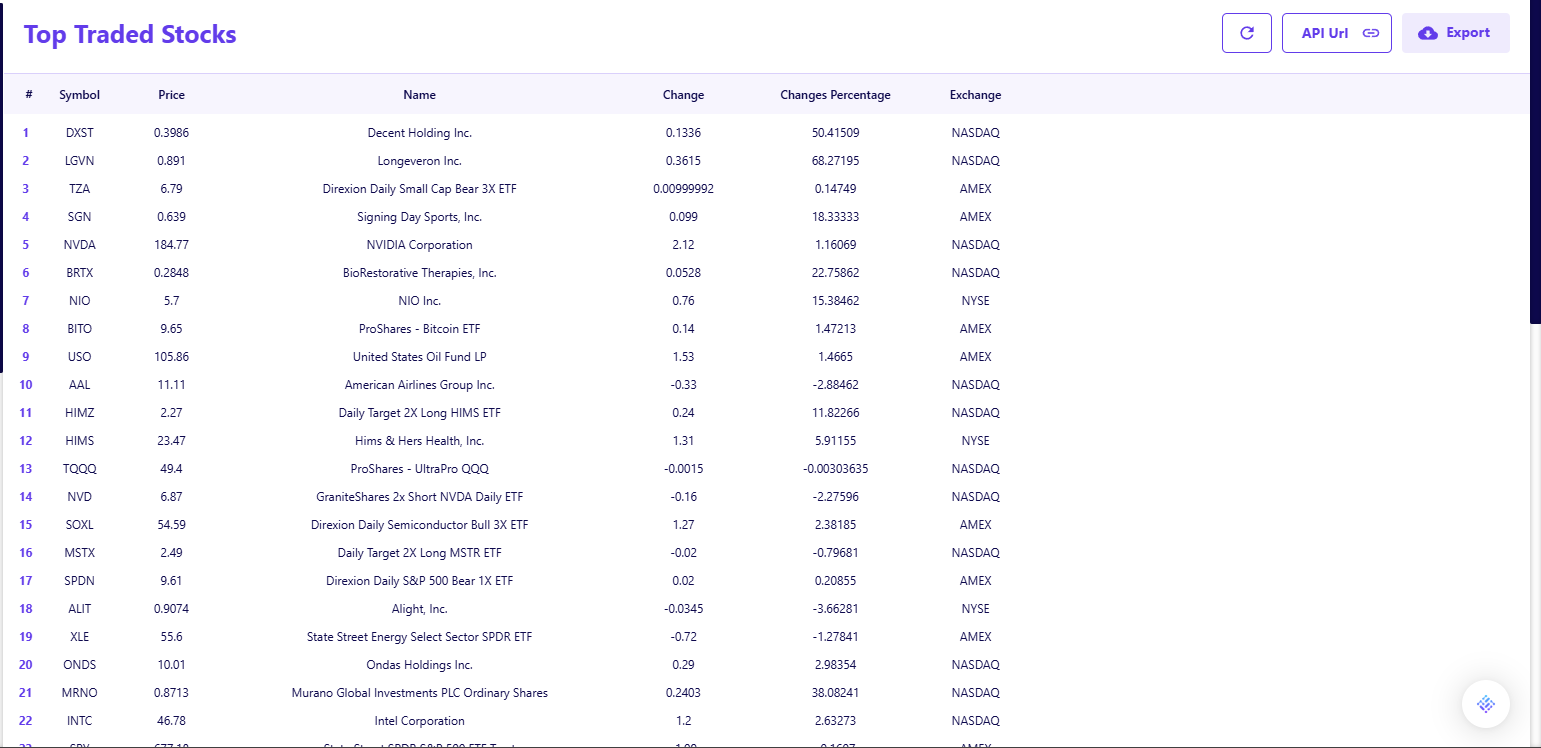
To track pure liquidity, the Most Active API ranks stocks solely by trading volume. A snapshot of top-traded stocks often juxtaposes highly volatile, low-priced assets like Decent Holding Inc. (DXST) directly alongside heavily traded mega-caps like NVIDIA (NVDA).
- Validating Price Moves: High volume validates a price movement. If an asset appears on both the gainers and the active lists simultaneously, the momentum is backed by heavy capital conviction.
- Identifying Traps: If a stock appears on the "Biggest Gainers" list but fails to register on the "Most Active" list, the price spike is occurring on low liquidity and might be a trap.
Building a Daily Market Dashboard
Combining these three endpoints provides the exact foundation needed to construct a comprehensive daily UI. By querying these lists shortly after the market opens or near the daily close, applications can track daily sentiment shifts simply by parsing the symbol, price, and changesPercentage returned in the JSON payload.
Translating this raw data into a snapshot based financial dashboard allows users to visualize market-wide momentum without requiring complex, server-side math to calculate price differences. To optimize these requests and prevent rate-limiting, developers should limit refresh frequency and avoid high-frequency polling, as the free plan is designed for low-volume usage. Account for the structural differences between intraday and historical data to ensure the API is queried at defined intervals (e.g., once per day or periodically) rather than continuously.
Synthesizing Market Momentum
Data without context is just noise. Retrieving gainers, losers, and active stocks gives you the what, but pairing percent change with volume gives you the why. A stock dropping 40% on 1,000 shares is a pricing anomaly; a stock dropping 40% on 10 million shares is a structural reality. By automating the retrieval of these lists via a free API, analysts and developers can stop manually hunting for volatile tickers and begin exploring potential catalysts driving the market.
Frequently Asked Questions
How do I sign up for the free API?
To sign up, visit the documentation page, scroll down to the sign-up box, and insert your email address. No credit card is required.
Is the free plan really free forever?
Yes, the free plan is designed for personal use and allows for 250 requests per day. This gives you ample room to explore endpoints without an expiration date.
Do I need a credit card to get an API key?
No, the free tier is accessible without any payment information. You only need to provide a credit card if you decide to upgrade to a premium plan for higher rate limits or additional datasets.
What constitutes a "Market Mover"?
A market mover is an equity experiencing an unusually high percentage change in price (either positive or negative) or trading at a significantly higher volume than the rest of the market during a single session.
How often are the Biggest Gainers and Losers updated?
These datasets are updated continuously during regular market trading hours to reflect the live percentage change from the previous day's official closing price.
Why do some stocks have high volume but low price changes?
Large institutional block trades, options expiration days, or broad index rebalancing can result in massive trading volume without significantly moving the underlying bid/ask spread, resulting in a minimal percentage change.
Can I retrieve market movers for specific sectors?
The standard market movers endpoints return the top assets across the entire global market. To filter by a specific sector or industry, you must retrieve the global list and filter the JSON response programmatically using associated company profile data.
Are these endpoints available on the free API tier?
Yes, the Biggest Gainers, Biggest Losers, and Most Active endpoints are completely accessible via the free tier, making them ideal for testing, research, and building introductory financial dashboards.







