Validate Management Guidance Through Integrated Financial Statement Analysis

Management commentary often carries more weight than the numbers themselves. A confident remark about demand, margins, pricing power, or cash flow can shape how investors read the quarter. The problem is that this commentary rarely gets validated against reported financial performance in a consistent way.
One analyst may treat management's tone as a positive signal. Another may focus on weaker margins, rising leverage, slower cash conversion, or pressure in working capital. Both can read the same commentary and reach different conclusions, because the review depends too much on individual judgment and too little on a shared evidence structure. The same guidance can support an optimistic read or a cautious one depending on which financial signals the analyst happens to anchor on first.
Closing that gap requires integrated financial statement analysis. When earnings commentary is tested against income statements, balance sheets, cash flow statements, profitability metrics, leverage indicators, and operating trends, the interpretation moves away from impression and toward evidence. The goal is not to summarize what management said. It is to compare each major claim against the reported financials, separate validated commentary from unsupported optimism, surface operational contradictions, and give analysts a consistent first-review reference before judgment is applied.
This article shows how that kind of validation can be supported using Financial Modeling Prep data and Claude MCP, applied to NVIDIA Corporation as the worked example.
Why Management Guidance Needs Financial Validation
Management commentary can make a quarter sound stronger or weaker than the financial statements suggest. A company may highlight resilient demand, pricing strength, or improving execution while the reported numbers show margin compression, weaker cash conversion, higher debt, or pressure in working capital.
That gap matters because guidance is not just a communication exercise. Investors and analysts use it to reset expectations, update forecasts, and judge whether the company's strategy still holds. When the narrative does not connect cleanly with financial evidence, interpretation drifts.
The risk shows up most clearly when transcripts and statements are reviewed in separate steps. Analysts often read the commentary first, form an early view, and then check revenue, margins, cash flow, and leverage on their own track. Positive language tends to anchor that early view, while contradictory signals in the statements may only register later, if at all. The opposite happens too: a careful comment can outweigh a strong set of numbers because it caught the analyst's attention first.
Disciplined validation does not mean defaulting to skepticism. The point is to test every major claim through the same evidence path. A demand or growth claim gets checked against revenue, margin behavior, and cash conversion. An efficiency claim gets checked against operating margin, cost movement, and profitability metrics. A financial flexibility claim gets checked against cash flow, leverage, and liquidity. The objective is to separate validated commentary from partial support, unsupported optimism, and clear operational contradiction.
For that test to hold up, the underlying data has to be aligned. The transcript, income statement, balance sheet, cash flow statement, ratios, and key metrics all need to map to the same company, the same reporting period, and the same reporting basis. If commentary from one quarter is compared against ratios pulled from a different period, or if statements use a different basis than the figures management referenced on the call, the validation can flag contradictions that are really data alignment issues, or miss real ones because the numbers do not line up. FMP's structured datasets remove that friction at the data layer, which is what makes a repeatable validation approach realistic in the first place.
The Data Foundation Behind Guidance Validation
Testing management commentary against reported performance only works if each claim can be matched with the right reported financial evidence. Six FMP datasets together form that evidence base, each handling a specific part of the validation.
The starting point is what management actually said. The Earnings Transcript API captures the commentary itself, including forward-looking remarks, demand and pricing language, margin explanations, cost discussions, and executive responses during Q&A. This is where Claude pulls the claims that need to be tested.
Revenue, margin, and profitability claims get checked against reported results through the Income Statement API. When management talks about demand strength, pricing power, or cost discipline, this is the dataset that shows whether revenue, gross profit, operating income, and net income actually moved in the direction the commentary implies.
Claims around liquidity, leverage, working capital, and financial flexibility need a different reference point. The Balance Sheet Statement API supplies cash, debt, receivables, inventory, and liabilities, which is what makes it possible to test whether confident language about balance sheet strength or capital allocation flexibility holds up against the actual capital structure.
Cash generation, earnings quality, and investment capacity claims sit on the Cash Flow Statement API. Operating cash flow, capital expenditure, and free cash flow are how Claude checks whether reported earnings are converting into cash, and whether management's framing of financial capacity matches what the business is producing. This is also where earnings quality issues show up first, when reported income looks healthy but cash conversion is weakening.
For interpretation to stay consistent across companies and quarters, the profitability, efficiency, leverage, and liquidity reads need to use the same reference frame. The Key Metrics API and Financial Ratios API provide that standardized layer. Together they give Claude a common basis for measuring margin quality, capital efficiency, leverage position, and liquidity coverage, so a margin or leverage claim from one company can be tested the same way as a similar claim from another.
These datasets are what let Claude move from extracting management claims to testing them. Without the standardized ratio and metric layer, validation would still depend on each analyst's choice of metric. Without aligned statements, commentary could be checked against the wrong period. The architecture is what makes the validation repeatable.
Accessing FMP Data via Claude MCP
To run this validation inside Claude, Financial Modeling Prep's data layer connects through its MCP server, which lets Claude retrieve datasets directly without manual API requests.
You first need an active FMP API key, which can be generated from your Financial Modeling Prep dashboard. This key is used to authenticate all MCP-based data requests.
Once the API key is available, FMP can be connected in Claude using its remote MCP endpoint:
|
https://financialmodelingprep.com/mcp?apikey=YOUR_FMP_API_KEY |
In Claude, navigate to Settings → Connectors → Add custom connector, and paste this URL into the Remote MCP Server field. After saving, Claude will automatically discover the available FMP tools.
For this validation use case, the orchestration is doing more than retrieval. Claude starts by reading the earnings transcript and identifying the testable claims, the statements that map cleanly to reported financial evidence rather than the general expressions of confidence that do not. MCP then exposes the relevant FMP datasets, and Claude selects which one to pull based on what each claim actually needs to be checked against. A margin claim routes to the income statement and profitability ratios. A balance sheet claim routes to liabilities, cash, leverage ratios, and liquidity. A cash conversion claim routes to operating cash flow, capex, and free cash flow.
The order Claude follows in practice looks like this:
- Extract major claims from the earnings transcript
- Group claims by financial theme
- Pull income statement, balance sheet, cash flow statement, key metrics, and financial ratios
- Match each claim against the relevant evidence
- Classify the claim as validated, partially validated, contradicted, or unsupported
- Produce a structured validation output for analyst review
The practical value is straightforward. The analyst does not have to stitch transcripts, statements, ratios, and metrics together before the validation review can begin. Claude handles the retrieval and the claim-to-evidence matching in one reasoning pass, and what reaches the analyst is a classified output that is ready to challenge or refine.
Guidance Validation Framework
The validation review starts by separating management commentary into claims that can actually be tested. Not every sentence on an earnings call carries analytical weight that can be checked against the statements. Broad expressions of confidence, thanks to employees, or directional language without a measurable referent do not map cleanly to reported data. The claims worth testing are the ones that point to growth, margins, cost discipline, cash generation, leverage, capital allocation, or operational efficiency, because each of these connects to specific lines in the financial statements or to a standardized ratio.
Once the testable claims are identified, each one gets grouped by financial theme, matched to the relevant FMP evidence, and classified based on how strongly the reported data supports the narrative.
Growth Claims
Growth commentary needs more than a directional read on revenue. Revenue moving in the right direction does not, on its own, validate a management claim about durable demand or improving customer activity. The supporting metrics matter: gross margin behavior, working capital movement, and cash conversion all help qualify how clean the growth actually is.
A growth claim holds up better when revenue improves without sharp margin pressure or weaker cash conversion. It looks more qualified when sales rise alongside expanding receivables, compressing margins, or operating cash flow that does not keep pace with reported growth. These supporting signals do not force a binary answer. They shape whether the claim is fully validated or partially supported.
Margin and Profitability Claims
Management often discusses pricing power, cost control, operating leverage, or efficiency gains. These claims need to be tested against gross margin, operating margin, net margin, operating income, and profitability ratios.
Margin pressure does not automatically contradict the claim. A decline in gross margin can reflect mix shift, input cost timing, planned investment in capacity or research, or a one-off expense, and the validation has to read the surrounding evidence before reaching a conclusion. If margins compress while pricing claims sound confident, the result may be partial validation rather than contradiction, especially if the supporting commentary explains the timing. If margins improve alongside stronger operating income and stable cost ratios, the claim earns clearer support.
Cash Flow Claims
Cash flow claims sit closer to earnings quality than to reported income. A company can post stronger earnings while operating cash flow weakens because of working capital pressure, tax timing, higher capex, or collection cycles. That is what makes cash conversion a useful check on commentary about financial flexibility, cash generation, or investment capacity.
That said, cash flow is timing-sensitive. A single soft quarter is not, on its own, a contradiction. Working capital can swing, tax payments can be lumpy, and capex tends to cluster. Where possible, claims should be reviewed across multiple periods, so a temporary movement is not mistaken for a structural shift. The pattern matters more than the single-quarter print.
Balance Sheet and Leverage Claims
When management talks about financial strength, flexibility, or capital allocation, the relevant evidence sits in cash, total debt, liabilities, leverage ratios, liquidity ratios, and debt movement over time.
Rising leverage or growing liabilities should be read as context, not as automatic red flags. The conclusion depends on what management is actually claiming and on the wider picture. Higher debt may weaken flexibility if cash flow is also softening, liquidity is tightening, or near-term refinancing needs are growing. The same increase may be fine if cash generation, liquidity coverage, and capital allocation priorities still leave room to fund the strategy management is describing. The validation has to weigh the claim against this fuller balance sheet read, not against a single line moving in either direction.
Operational Efficiency Claims
Claims about productivity, disciplined operations, or improved execution need operating evidence behind them. The specific metric depends on the claim. Faster customer collections, stable or declining days sales outstanding, and disciplined receivables movement support claims about commercial execution. Inventory growth that tracks revenue can validate operational scaling, while inventory that runs ahead of revenue may indicate weaker demand absorption. Cost ratios and operating margin behavior validate claims about cost discipline. Working capital movement and asset efficiency ratios validate claims about capital productivity.
Where commentary uses general language about "better execution" without pointing to a specific dimension, the validation has to be more careful. There has to be a financial signal the claim can reasonably be tested against, otherwise the most accurate classification is unsupported by the available data rather than contradicted.
Validation Classification
Each claim is classified into one of four categories.
- Validated: The reported financial data supports the management claim.
- Partially Validated: Some indicators support the claim, but other metrics qualify or weaken the narrative.
- Contradicted: The financial evidence moves clearly against the management claim.
- Unsupported: The retrieved financial data does not provide enough evidence to confirm the claim. This is not the same as concluding the claim is wrong. It means the data on hand does not allow a confident validation, and the analyst should treat that gap as a flag for further review rather than as a verdict.
These categories are designed to support analyst review, not replace it. The classification narrows the question the analyst needs to answer, but the final read still depends on sector context, business model, reporting period dynamics, and prior trends that no single quarter's data fully captures.
Running the Claude MCP Prompt
To test the framework, this article uses NVIDIA Corporation (NVDA). NVIDIA works well for this validation exercise because management commentary covers demand, data center growth, AI infrastructure momentum, margins, supply conditions, cash generation, balance sheet strength, and capital allocation. These claims can be tested directly against reported revenue, profitability, cash flow, leverage, and operating efficiency.
A manual review can still miss important contradictions. Analysts may read the earnings commentary first, form an initial view, and then check the statements separately. This prompt forces the process to move in the opposite direction: extract the claim, retrieve the evidence, validate the statement, and classify the result.
Use the following Claude MCP prompt:
|
Use Financial Modeling Prep data through MCP to validate whether NVIDIA Corporation's management commentary aligns with reported financial performance. Company: NVIDIA Corporation Ticker: NVDA Retrieve the latest available earnings commentary, income statement, balance sheet statement, cash flow statement, key metrics, financial ratios, profitability metrics, leverage metrics, and operational trend indicators for NVIDIA. First, extract the main management claims from the latest earnings commentary. Group them into themes such as: - revenue growth - data center demand - AI infrastructure momentum - margins - cost discipline - operating efficiency - cash flow - balance sheet strength - leverage - capital allocation Then validate each claim against reported financial data. For every claim, classify the result as one of the following: - Validated - Partially Validated - Contradicted - Unsupported For each classification, explain: - the management claim - the financial evidence used - whether the evidence supports or weakens the claim - the key confirmation, qualification, or contradiction - the analyst interpretation Pay special attention to: - whether revenue growth is supported by margin consistency - whether data center growth is supported by operating performance - whether cash flow supports management's financial flexibility narrative - whether balance sheet and leverage trends support capital allocation confidence - whether profitability metrics support claims around operational strength - whether any positive commentary looks stronger than the reported evidence supports Also create a compact guidance validation matrix with the following columns: Claim Theme | Management Narrative | Financial Evidence | Validation Status | Interpretation Priority Also create a compact validation summary, such as a matrix or classification grid showing which management claims are validated, partially validated, contradicted, or unsupported. Keep the full response focused and analysis-ready. Avoid a generic company summary. Do not write a long research memo. Focus on validation, contradiction detection, and interpretation consistency. |
The output that follows in the next section is taken from a specific run of this prompt. The figures, period references, and classifications are attributed to Claude's retrieved output from that run, not stated as standing facts about NVIDIA.
Interpreting NVIDIA's Guidance Validation Output
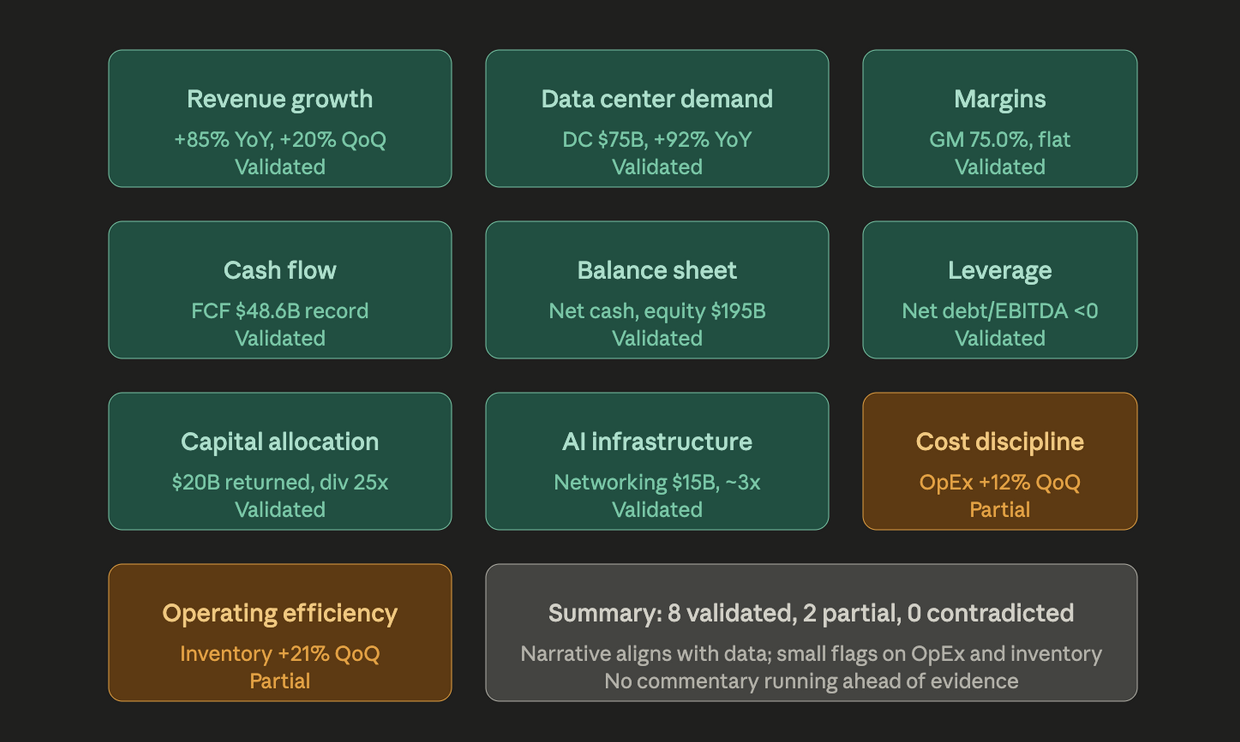
In the run referenced here, Claude pulled NVIDIA's most recent earnings commentary and matched it against FMP income statement, balance sheet, cash flow, key metrics, and ratio data for the same reporting period, which Claude's output identified as Q1 FY27 ending April 26, 2026. Management claims were grouped into themes covering revenue growth, data center demand, AI infrastructure momentum, margins, cost discipline, operating efficiency, cash flow, balance sheet strength, leverage, and capital allocation. Of those, Claude classified eight as validated and two as partially validated, with no claims classified as contradicted. The discussion below ties each major figure back to the specific claim it supports or qualifies, rather than reading as a quarter recap.
Where the Financial Evidence Supported the Narrative
Management's growth and demand commentary was the most directly testable, and Claude's output reported it as supported by the retrieved data. Per the run, revenue for the quarter reached $81.62 billion, up 85.2 percent year over year and 19.8 percent sequentially, which is the figure that validates the broader growth claim. Data center revenue of $75 billion, growing 92 percent year over year, is what specifically validated the AI infrastructure and data center demand commentary, since those claims would otherwise have rested on language alone.
Margin and cash conversion commentary held up against the same retrieval. GAAP gross margin of 74.9 percent, roughly flat sequentially, supported management's pricing power and margin stability claims. Free cash flow, reported in Claude's output at $48.59 billion for the quarter, validated the cash generation and earnings quality language, because reported earnings of that scale only support a financial flexibility claim when the cash conversion follows. The combined effect was not that NVIDIA had a strong quarter, which is a separate observation. It was that the financial evidence retrieved through MCP supported most of the testable claims management had made.
How Capital Allocation Commentary Held Up
Management's capital allocation posture is the kind of claim that can sound confident on its own but only earns credibility when liquidity, debt, and cash flow support it. Per Claude's output, NVIDIA's cash and short-term investment position remained well above total debt, leaving the company in a net cash position, while approximately $20.0 billion was returned to shareholders through buybacks and dividends during the quarter.
The evidence here supports the capital return commentary rather than proves a forward-looking capital allocation strategy. Aggressive return language tends to weaken when leverage rises or liquidity tightens, which was not the case in the retrieved figures. Net cash, the free cash flow read referenced above, and the size of the actual returns relative to the balance sheet are what made the commentary credible in this run. That is a narrower conclusion than "the balance sheet validates the capital allocation strategy," and it is the right one for a single-period validation.
Where Claims Needed Qualification
The two partially validated themes are the more analytically useful part of the output, because they show where validation does not collapse into a binary read.
Per Claude's retrieved output, operating expenses rose 12.2 percent sequentially, and the full-year operating expense outlook had moved higher. That is why cost discipline was classified as partially validated rather than validated. The expense growth does not contradict the commentary on its own. It may reflect investment in research, infrastructure, or hiring to support the demand environment management was describing. But it qualifies the cost discipline claim enough that an analyst should not accept the language at face value without reviewing where the spend is going.
Inventory growth of 20.5 percent sequentially, combined with NVIDIA's large forward supply commitment, sits in a similar place. The inventory build may reflect supply-chain planning for expected demand, or preparation for new product cycles, in which case it supports the demand narrative. It may also represent risk if demand normalizes or if hyperscaler ordering shifts. Neither reading is a contradiction of the current quarter. The classification flags the item as something analyst review should weigh against future demand delivery, not as evidence against the latest results.
Final Validation View
The output is most useful as a claim-by-claim read, not as a single conclusion about the quarter. Growth, data center demand, margins, cash flow, leverage, and capital allocation came through as supported in this run. Cost discipline and inventory build came through as partially validated, with the qualifications attached to specific operating signals rather than to the overall narrative.
That separation is the point of running guidance through this kind of structured validation. It moves the analyst review away from a general impression of management tone and toward specific claims that hold up, specific claims that need more context, and specific evidence that should be revisited on the next call.
Why This Improves Interpretation Consistency
Management commentary often leaves room for different conclusions. One analyst may focus on confident demand language, while another may give more weight to expense growth, working capital movement, or leverage changes. Without a shared evidence path, both reads can sound reasonable even when they rely on entirely different signals from the same quarter.
A structured validation approach narrows that gap. Each major claim moves through the same evidence path: transcript claim, relevant financial metric, validation status, and interpretation priority. The review becomes less dependent on tone and more dependent on reported performance, supported by ratios that compare profitability, efficiency, leverage, and liquidity using a consistent reference.
That consistency only holds if the underlying data is consistent. Transcript claims, statements, ratios, and key metrics all need to align to the same company record and the same reporting period. If commentary from one quarter is tested against ratios pulled from a different period, or against figures reported on a different basis, the output starts flagging mismatches that are really data issues rather than narrative gaps. The reliability of FMP's structured datasets is what keeps the validation output comparable across companies and quarters in the first place.
For research teams, this creates a more consistent starting point for review. Analysts can still apply judgment, but they begin from the same classification logic. A revenue claim, margin claim, or cash flow claim gets tested the same way across coverage. The point is not to remove judgment from the process. It is to improve where judgment begins, so debate moves past management tone and onto the specific claims that are validated, partially supported, or contradicted by the financial data.
Where Guidance Validation Needs Analyst Review
A structured validation approach makes the first review more consistent, but it cannot remove business context from the analysis. Management commentary often points forward, while financial statements mostly reflect what has already happened.
That timing gap matters most when management talks about future demand, pricing, supply commitments, or investment plans. Current-period statements can show whether the company has the financial capacity to execute on those plans, but they cannot fully validate the forward claim itself. A confident demand outlook is not the same kind of statement as a reported revenue line, and the right classification in those cases is often partially validated, or unsupported by current data, rather than contradicted.
Sector context shapes the read further. Higher inventory may signal demand risk in one business and planned capacity expansion in another. Rising operating expenses may indicate weaker discipline or heavy investment in research, infrastructure, or hiring. The same ratio movement can support or qualify a claim depending on the business model and the stage the company is in.
Single-period data has its own limits. Cash flow can shift because of working capital timing, tax payments, or capital expenditure cycles. A soft quarter on operating cash flow does not necessarily contradict a management claim about cash generation if the next two quarters reverse the pattern. The validation works better when analysts compare multiple periods, particularly for claims about cash, capital allocation, and operating efficiency.
These are the situations where the classification needs to acknowledge incomplete evidence rather than reach a clean verdict. Marking a claim as partially validated, or flagging it for further review, is often the more honest read when the supporting data does not yet cover what the commentary is pointing to. The point of running guidance through a structured validation is to give analysts a more consistent starting point for that judgment, not to replace it.
From Management Narrative to Evidence-Based Guidance Review
Management commentary becomes more useful when each claim can be tested against reported performance. In NVIDIA's case, the validation output classified most core claims as supported by the financial evidence, while operating expense growth and inventory build came through as partially validated and worth closer review.
Three roles make that kind of evidence-based read possible. Financial Modeling Prep provides the transcript, statement, ratio, and metric data. MCP coordinates access across those datasets in one reasoning pass. Claude organizes the evidence into a repeatable validation structure, matching each management claim to the right financial signal and classifying the result.
Teams that want to apply this approach across a wider coverage list, deeper statement history, or higher run volumes can review FMP's pricing plans to match dataset access and usage to how their guidance review process actually runs. As coverage expands, the value of aligned transcript, statement, ratio, and metric data only increases, because the validation output is only as consistent as the underlying records.
The result is not a replacement for analyst judgment. It is a stronger starting point for it. Analysts move beyond a general impression of management tone and toward a clearer view of which claims are supported by the financial evidence, which claims need qualification, and which claims require deeper review on the next call.

Financial APIs, Claude MCP, and AI-driven research workflows
Pranjal Saxena writes technical content focused on financial data APIs, Claude MCP workflows, AI-driven research systems, and Python-based market analysis. For FMP, his work centers on turning structured financial data into practical, workflow-driven content for developers, analysts, and fintech teams. He combines experience in data science, NLP, generative AI, and financial API workflows to show how APIs, automation, and AI-assisted systems can support modern financial research and analysis.
Related




Financial data for every need
Real-time quotes and 30+ years of historical data, including prices, fundamentals, and insider transactions — all accessible via API.
Create Free Account