In this guest post, Kostadin Medarov, creator of Stockpicker, shares how the platform uses FMP's historical data to help investors compare companies and assess their performance over time.
I wanted decades of historical financial data on every company I looked at. After failing to find it at a retail price that worked for me, I built Stockpicker on the Financial Modeling Prep API instead.
Stockpicker covers more than 13,000 global equities with up to 40 years of historical financial data. Company pages show the business measured against its own past, and the Stockpicker Comparison Tool puts up to four companies side by side on the same metrics, whatever industry they sit in.
Why Does Historical Context Matter in Stock Research?
A current number on its own gives you little to judge it by. Four or five quarters is enough to tell you what a company's operating margin is right now. It is not enough to tell you how that margin compares with the company's longer history.
Return on invested capital of 18% is a fact. Whether 18% is normal for that company, or the best year it has had in a decade, or the start of a slide down from 25%, is the actual question. I kept ending up in the same position, staring at a number I had no way to judge.
What Does 40 Years of Historical Financial Data Show You?
It shows you how a business performed through full economic cycles instead of through the last twelve months. With free cash flow, operating margin and return on invested capital going back decades, you can see what happened to a company in 2008, whether it recovered, and how long the recovery took.
Dips and spikes are where the information sits. A company whose margin fell for two quarters and came back has a different record from one where margins have compressed every year since 2015. A four-quarter chart can hide that difference. Microsoft's financial history on Stockpicker goes back to 1986, so you can follow the business through four decades rather than just through last year.
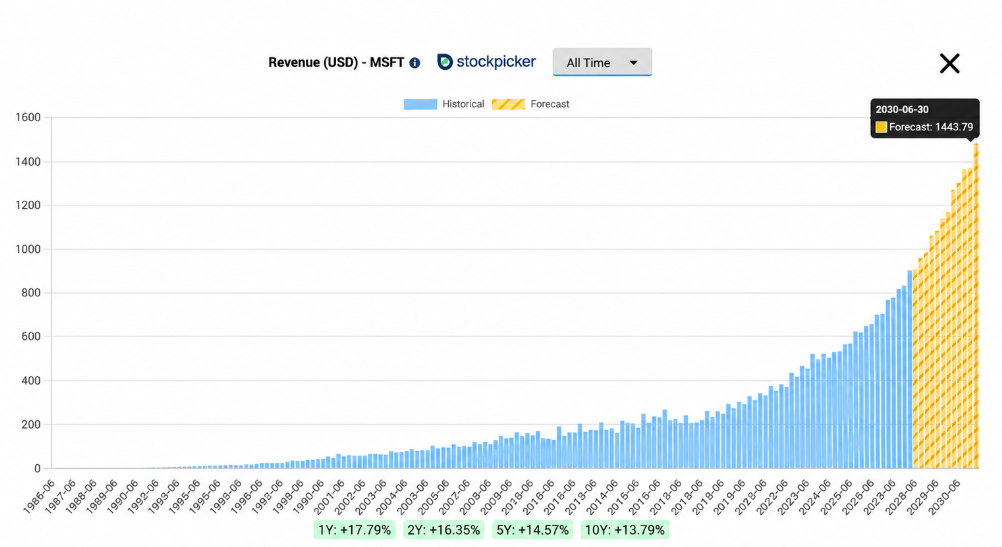
Microsoft revenue history beginning in 1986. Blue bars show historical results; yellow bars show forecasts drawn from FMP's analyst estimates
How Do You Compare Two Companies That Are Not In the Same Business?
You can compare them directly on the same metrics instead of measuring each one only against an industry average. The Stockpicker Comparison Tool does this with up to four companies at a time, across six metrics you choose from a larger list, over a window of up to five years, regardless of what sector anyone has filed them under.
Industry classifications are a starting point. Business models, size and reporting periods all shape how a comparison should be read. Check the periods behind the figures, since companies' fiscal quarters do not always cover the same months.
Apple (AAPL) and IBM sit under the same broad technology label, and underneath they are not the same business. They earn money differently, they grow differently, and the market can value them very differently. Averaging them together can hide those differences.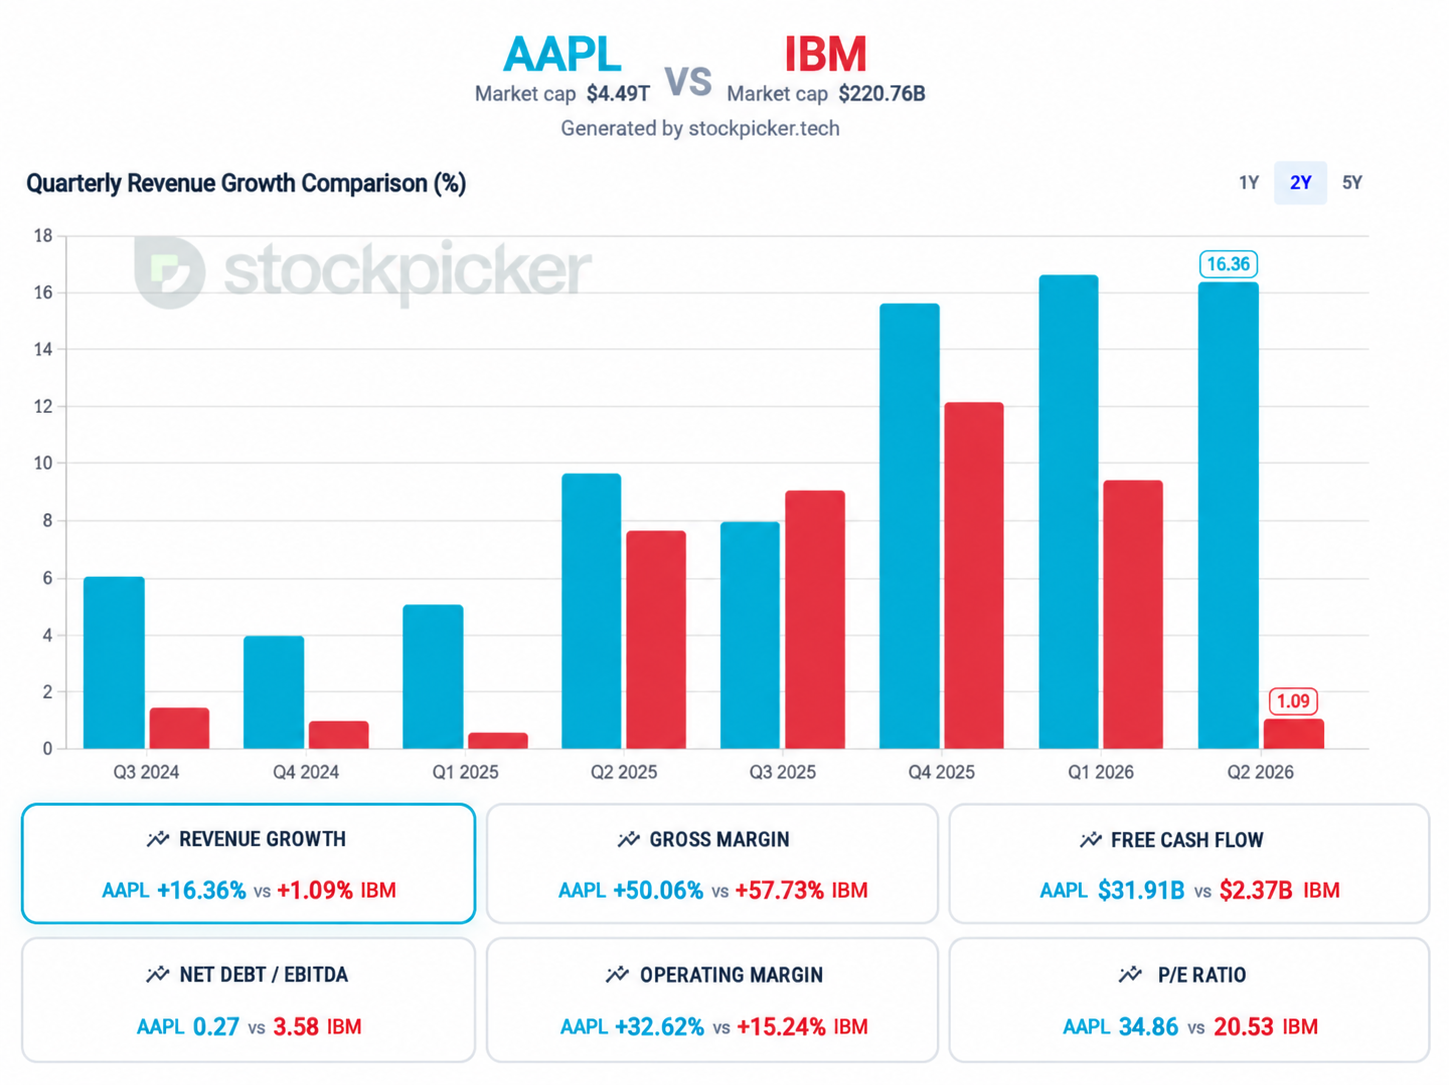
Apple and IBM in the Stockpicker Comparison Tool, with the two-year view selected for quarterly revenue growth and six financial metrics shown below.
The second half of the problem is comparing a company to its own past. If a stock trades at 24 times earnings today, the useful question is what it usually trades at, and what was happening in the business the last time it traded at that multiple. This is the comparison I use most, so the company pages carry that view alongside the cross-company one.
Why I chose Financial Modeling Prep
I wanted depth of history, breadth of coverage, and consistent structure across the whole universe. I started from those requirements rather than from any particular provider, and Financial Modeling Prep was the one that met them:
- History going back 30 years or more, where available
- Global coverage, because I did not want to build a US-only tool
- Financial statements structured the same way across thousands of companies
- One provider instead of several stitched together
The structure requirement matters more than it sounds. When the data is consistent, one page layout works for a company that has been reporting since the 1980s and for one that listed last year, although some markets still need exceptions, mainly around currency conversion.
What Is Stockpicker?
Stockpicker is a fundamental stock research platform for individual investors, covering more than 13,000 global equities with up to 40 years of financial history. Company pages show financial statements, operating margins, returns on capital, free cash flow and valuation history, all in charts so you can see the trend without reading a table. You can put up to four companies side by side on the same metrics, and each company page has an AI analysis that reads that company's numbers and writes up what it sees.
The reason for showing it this way is that each current number comes with something to measure it against. Revenue of $10 billion tells you more once you can see whether it is the highest the company has reported in ten years or the lowest.
Here is how you can start with Stockpicker:
- The permanent free plan shows historical charts for revenue, net income and operating income, with the available history depending on the company.
- You can start a seven-day free trial with no credit card required.
- After the trial, Premium costs $10 a month. Pro costs $20 a month and includes more credits for AI reports.
About the Author
Kostadin Medarov is the founder of Stockpicker, a fundamental stock research platform built on the Financial Modeling Prep API.